Chapter 7: Network Operations, Tools & Troubleshooting
Knowing how networks work is only half the job; the other half is keeping them running and fixing them when they break. This chapter is your toolbox: the commands, capture tools, monitoring systems, automation frameworks and field gear that network technicians and engineers use every day. It finishes with a proven troubleshooting method and the habits that stop small mistakes from turning into outages.
7.1 Windows Networking Commands: CMD & PowerShell
Windows comes with built-in text commands that tell you your computer's network settings and test whether other machines can be reached. You type them into Command Prompt or PowerShell (the black or blue text windows). They are free, always available and the first thing a help-desk technician reaches for.
Think of it like…
These commands are like the dashboard lights and gauges in a car: before you open the bonnet, you glance at them to see what is wrong.
Real-world example
Priya at a small accounting firm says 'the internet is down'. The technician runs ipconfig /all and sees her laptop has the address 169.254.12.7, a self-assigned address that means DHCP failed. Running ipconfig /release and ipconfig /renew gets a proper 192.168.10.45 address, and ping 8.8.8.8 now succeeds. Total fix time: two minutes, no ladder needed.
How it works
- Check your own settings first: ipconfig /all shows IP address, mask, gateway, DNS servers and MAC address.
- Test reachability: ping the gateway, then a public IP, then a name like example.com.
- If names fail but IPs work, test DNS with nslookup or Resolve-DnsName.
- Find where traffic stops with tracert or pathping.
- Check which programs hold which ports with netstat -ano, and test a specific port with Test-NetConnection.
Who uses it
Help-desk and desktop-support staff, Windows server administrators and anyone studying for CompTIA A+ or Network+.
Key takeaway
Exam favourite: an address starting 169.254.x.x is APIPA, meaning the PC could not reach a DHCP server.
Going deeper
- ipconfig /all decoded: an address in 169.254.0.0/16 means APIPA (no DHCP reply), a blank default gateway means no route off the subnet, and 'Media disconnected' means no Layer 1 link at all.
- Windows ping sends four 32-byte echo requests by default; -t repeats until Ctrl+C, -n sets the count, -l the size, -f sets Don't Fragment and -4 or -6 force the IP version.
- Windows tracert probes with ICMP echo requests and rising TTL, three per hop, while Linux traceroute defaults to UDP; a firewall allowing one but not the other explains differing results.
- netstat -ano combined with tasklist /fi "PID eq 1234" or Get-Process -Id 1234 maps a listening port to the exact program, a classic check for port conflicts or unexpected services.
- PowerShell cmdlets such as Get-NetIPConfiguration, Get-NetRoute, Get-DnsClientServerAddress and Clear-DnsClientCache return objects you can filter, export to CSV and run remotely across many PCs.
- Built-in pktmon captures packets and counts drops inside the Windows stack; converting its .etl file to pcapng lets you analyse it in Wireshark on another machine.
Common mistakes & misconceptions
- Assuming 'Request timed out' means the host is down; Windows Defender Firewall often blocks inbound ping, so also test a real service port.
- Running ipconfig /release on a remote PC over Remote Desktop, which drops your own session before you can type /renew.
- Forgetting ipconfig /flushdns after DNS records change, then blaming the server while the PC keeps using its cached, outdated answer.
- Running repair commands in a non-elevated prompt; netsh resets, route add and netstat -b need 'Run as administrator'.
Try it: A quick Windows health check (PowerShell)
ipconfig /all
ping -n 4 example.com
tracert example.com
Resolve-DnsName example.com
Test-NetConnection example.com -Port 443
netstat -ano | findstr LISTENING
Key protocols, devices, standards & tools
| Name | What it does | Example |
|---|---|---|
| ipconfig /all Microsoft (built into Windows) · Command · Layer 3 · Current |
Shows every network adapter with its IP address, subnet mask, default gateway, DNS servers, DHCP lease and MAC address. | ipconfig /all reveals the DNS server is 10.0.0.53; ipconfig /flushdns clears cached names; ipconfig /release then /renew asks DHCP for a new lease. |
| ping Built into Windows; uses ICMP (IETF RFC 792) · Command · Layer 3 · Current |
Windows ping sends four ICMP echo requests by default and reports replies, round-trip times and loss; flags change count, size and fragmentation. | ping -t 192.168.1.1 runs until Ctrl+C while you wiggle a cable; ping -f -l 1472 example.com tests whether a full-size packet fits. |
| tracert Microsoft (Windows version of traceroute) · Command · Layer 3 · Current |
Lists each router (hop) between you and a destination by sending packets with increasing TTL values. | tracert example.com shows hops 1-4 fine, then asterisks from hop 5, pointing to a problem at or after the ISP edge. |
| pathping Microsoft · Command · Layer 3 · Current |
Combines tracert and ping: finds every hop, then sends many pings to each one to calculate packet loss per hop. | pathping example.com takes a few minutes but reports 12% loss starting at hop 3, the ISP's first router. |
| nslookup Microsoft (also on Linux/macOS) · Command · Layer 7 · Current |
Asks a DNS server to translate a name into an IP address (or other record types) so you can check name resolution. | nslookup example.com 1.1.1.1 asks Cloudflare's resolver directly, bypassing the office DNS server to compare answers. |
| Resolve-DnsName Microsoft PowerShell (DnsClient module) · Command · Layer 7 · Current |
PowerShell cmdlet for DNS lookups that returns structured objects and supports any record type. | Resolve-DnsName contoso.example -Type MX lists the mail servers for a domain. |
| netstat -ano Microsoft · Command · Layer 4 · Current |
Lists all TCP/UDP connections and listening ports (-a), numeric addresses (-n) and the owning process ID (-o). | netstat -ano | findstr :3389 shows whether Remote Desktop is listening and which PID owns it; check the PID in Task Manager. |
| arp -a Microsoft (ARP: IETF RFC 826) · Command · Layer 2 · Current |
Displays the ARP cache: which IP addresses on the local network map to which MAC addresses. | arp -a shows 192.168.1.1 at MAC 3c:84:6a:..., confirming the PC has learned the router's hardware address. |
| route print Microsoft · Command · Layer 3 · Current |
Shows the computer's routing table: which gateway and interface it uses for each destination network. | route print reveals two default routes after a VPN connects, explaining why some traffic bypasses the tunnel. |
| netsh Microsoft · Command · Multi-layer · Current |
Network shell for viewing and changing many settings: Wi-Fi profiles, firewall rules, interfaces and Winsock resets. | netsh wlan show interfaces shows Wi-Fi signal strength and channel; netsh int ip reset repairs a broken TCP/IP stack. |
| Test-NetConnection Microsoft PowerShell (NetTCPIP module) · Command · Layer 4 · Current |
PowerShell tool (alias tnc) that pings a host, tests a specific TCP port, or runs a trace route in one command. | Test-NetConnection mail.contoso.example -Port 587 shows 'TcpTestSucceeded : True' when the mail submission port is open. |
| Get-NetIPAddress Microsoft PowerShell (NetTCPIP module) · Command · Layer 3 · Current |
Lists IPv4 and IPv6 addresses on each interface as objects you can filter and script. | Get-NetIPAddress -AddressFamily IPv4 | Select InterfaceAlias, IPAddress, PrefixLength gives a tidy address table. |
| getmac Microsoft · Command · Layer 2 · Current |
Prints the MAC (hardware) address of each network adapter, handy for DHCP reservations or switch port lookups. | getmac /v shows the Wi-Fi adapter's MAC so the admin can create a DHCP reservation for a printer. |
| Get-NetAdapter Microsoft PowerShell (NetAdapter module) · Command · Layer 2 · Current |
Lists network adapters with status (Up or Disconnected), link speed and MAC address; related cmdlets enable, disable or restart adapters. | Get-NetAdapter shows Ethernet 'Up' at 100 Mbps instead of 1 Gbps, hinting at a damaged cable or a faulty switch port. |
| pktmon Microsoft (Packet Monitor, built into Windows 10 and 11) · Command · Multi-layer · Current |
Built-in packet capture and drop-counting tool that sees traffic inside the Windows network stack without installing extra software. | pktmon start --capture, reproduce the fault, pktmon stop, then pktmon etl2pcap PktMon.etl converts the capture for Wireshark. |
7.2 Linux & macOS Networking Commands: iproute2, ss & dig
Linux and macOS have their own set of network commands, typed into the Terminal. Most servers, routers, firewalls and cloud machines run Linux, so these commands are essential for any networking job. Some older commands (ifconfig, netstat) still work but have been replaced by newer ones (ip, ss) on Linux.
Same job, three toolsets
| Legacy net-tools | Modern Linux | macOS | |
|---|---|---|---|
| Addresses | ifconfig | ip addr | ifconfig |
| Routes | route -n | ip route | netstat -rn |
| ARP / neighbours | arp -n | ip neigh | arp -a |
| Listening sockets | netstat -tulpn | ss -tulpn | lsof -i -P |
| Link up/down | ifconfig eth0 up | ip link set eth0 up | ifconfig en0 up |
| DNS settings | cat /etc/resolv.conf | resolvectl status | scutil --dns |
Learn the iproute2 column for Linux; macOS still uses BSD-style tools.
Think of it like…
If Windows tools are a car dashboard, Linux tools are a mechanic's full diagnostic kit: more knobs, more detail, and they work on almost any engine.
Real-world example
Tomás manages a Linux web server that customers cannot reach. He runs ss -tlnp and sees nginx listening only on 127.0.0.1:80 instead of 0.0.0.0:80, so it only accepts local connections. He fixes the listen line in the config, reloads nginx, and curl -I http://203.0.113.20 from his laptop now returns 'HTTP/1.1 200 OK'.
How it works
- Check addresses and links with ip addr and ip link.
- Check the default gateway with ip route and neighbours (ARP/NDP) with ip neigh.
- Test reachability with ping -c 4 (Linux ping runs forever otherwise), then the path with traceroute or mtr.
- Test DNS with dig or host.
- Check listening ports with ss -tulpn, and test services with curl or nc.
Who uses it
Linux system administrators, cloud and DevOps engineers, network engineers on router/firewall shells, and macOS power users.
Key takeaway
Learn the iproute2 commands (ip, ss): ifconfig, route, arp and netstat come from the old net-tools package and are missing on many modern Linux systems.
Going deeper
- iproute2 replaced net-tools because it talks to the kernel through netlink and understands modern features: multiple addresses per interface, policy routing tables, network namespaces, VRFs and tunnels.
- Changes made with ip are not persistent; permanent settings live in NetworkManager (nmcli), systemd-networkd, netplan on Ubuntu or /etc/network/interfaces on Debian, depending on the distribution.
- ss can filter by state and port, for example ss -tn state established '( dport = :443 )', and ss -s prints totals, handy when a busy server runs short of sockets.
- Many distributions resolve names through systemd-resolved: /etc/resolv.conf points at the stub 127.0.0.53, and resolvectl status shows the real upstream DNS servers for each interface.
- On macOS, networksetup configures interfaces and DNS, scutil --dns shows resolver order, and route get example.com reveals which interface and gateway a destination will use.
- Raw-socket tools such as traceroute -I, tcpdump and nmap SYN scans need root or the CAP_NET_RAW capability, which is why sudo appears so often in network commands.
Common mistakes & misconceptions
- Typing ifconfig or netstat on a minimal Linux server and concluding the network is broken; net-tools is simply not installed, so use ip and ss.
- Forgetting that Linux ping runs forever; scripts hang unless you add -c 4 (count) or -w 5 (deadline in seconds).
- Editing /etc/resolv.conf by hand where NetworkManager or systemd-resolved regenerates it, so the change silently vanishes after a reboot.
- Reading ss or netstat output without -n, so service names hide the actual port numbers you are trying to check.
Try it: A quick Linux health check
ip -br addr
ip route
ip neigh
ping -c 4 example.com
dig example.com +short
ss -tulpn
curl -I https://example.com
Key protocols, devices, standards & tools
| Name | What it does | Example |
|---|---|---|
| ip (addr / route / neigh / link) iproute2 project (Linux kernel networking) · Command · Multi-layer · Current |
The modern all-in-one Linux tool to view and change addresses, routes, ARP/neighbour entries and interface state. | ip -br addr gives a one-line-per-interface summary; ip route shows 'default via 192.168.1.1 dev eth0'. |
| ifconfig net-tools (Linux); BSD (macOS) · Command · Layer 3 · Legacy |
Older command to show and set interface addresses. Deprecated on Linux, but still the normal tool on macOS. | On a Mac, ifconfig en0 shows the Wi-Fi interface's IPv4 and IPv6 addresses and MAC (ether) address. |
| traceroute Linux/BSD (Van Jacobson's original, 1987) · Command · Layer 3 · Current |
Shows each router hop to a destination. Uses UDP probes by default on Linux/macOS; -I uses ICMP, -T uses TCP. | traceroute -T -p 443 example.com traces using TCP port 443, useful when firewalls block normal probes. |
| mtr Open source (My Traceroute) · Tool · Layer 3 · Current |
Live combination of ping and traceroute that continuously updates loss and latency for every hop. | mtr -rwc 100 example.com sends 100 rounds and prints a report you can paste into a ticket for your ISP. |
| dig ISC (part of BIND tools) · Command · Layer 7 · Current |
Detailed DNS lookup tool showing the question, answer, TTL, flags and which server replied. | dig @1.1.1.1 example.com AAAA asks Cloudflare for the IPv6 address; dig +trace follows the lookup from the root servers. |
| host ISC (part of BIND tools) · Command · Layer 7 · Current |
Simple, short-output DNS lookup command, good for quick forward and reverse lookups. | host 8.8.8.8 does a reverse lookup and returns dns.google. |
| ss iproute2 project · Command · Layer 4 · Current |
Socket statistics: lists TCP/UDP connections and listening ports, faster and more detailed than netstat. | sudo ss -tulpn shows TCP/UDP listeners with numeric ports and process names, e.g. sshd on 0.0.0.0:22. |
| netstat net-tools (Linux); BSD (macOS) · Command · Layer 4 · Legacy |
Older tool for connections, listening ports and routing tables; replaced by ss and ip on Linux, still used on macOS. | On macOS, netstat -rn shows the routing table and default gateway. |
| nmcli NetworkManager project (Red Hat) · Command · Multi-layer · Current |
Command-line control for NetworkManager: list connections, join Wi-Fi, set static IPs on desktop and server distributions. | nmcli device wifi list shows nearby networks; nmcli con show lists saved connection profiles. |
| ethtool Linux kernel community · Command · Layer 1 · Current |
Shows and sets Ethernet card details: link speed, duplex, auto-negotiation, driver and error counters. | ethtool eth0 shows 'Speed: 100Mb/s, Duplex: Half', a clue that a gigabit cable or port is faulty. |
| curl Daniel Stenberg and the curl project · Tool · Layer 7 · Current |
Transfers data with URLs; great for testing web servers and APIs and viewing HTTP headers and TLS details. | curl -I https://example.com shows status code and headers; curl -v adds the TLS handshake and request details. |
| wget GNU Project · Tool · Layer 7 · Current |
Downloads files over HTTP, HTTPS and FTP from the command line, with retry and resume support. | wget https://example.com/ saves the home page as index.html, confirming the web server answers. |
| nc (netcat) Open source (several variants: OpenBSD, Nmap ncat) · Tool · Layer 4 · Current |
Opens raw TCP or UDP connections; useful to check whether a port on your own server or lab is open. | nc -zv 192.168.1.10 22 on your own lab reports 'succeeded' if SSH is listening on that host. |
| whois IETF RFC 3912; RDAP (RFC 9082/9083) now preferred · Command · Layer 7 · Current |
Looks up who registered a domain or IP block. ICANN replaced WHOIS with RDAP for generic top-level domains in January 2025. | whois 8.8.8.8 shows the address block belongs to Google, useful when tracing an unknown IP in your logs. |
| resolvectl systemd-resolved (systemd project) · Command · Layer 7 · Current |
Queries and controls systemd-resolved, the local DNS stub on many Linux distributions, showing per-interface DNS servers and cache. | resolvectl status shows the VPN interface uses 10.8.0.1 for corp.example names; resolvectl flush-caches clears stale answers. |
7.3 Packet Capture & Protocol Analysis
Packet capture means recording a copy of the actual data packets crossing a network so you can inspect them one by one. A protocol analyzer then decodes each packet into readable fields, such as 'DNS query for example.com'. It is the ultimate proof of what really happened on the wire.
Think of it like…
It is like a CCTV recording of a busy road: instead of guessing why a delivery was late, you rewind and watch every vehicle that passed.
Real-world example
Users at a clinic complain a web app is slow. Network engineer Ama captures traffic on her own PC with Wireshark while reproducing the problem and applies the display filter dns. She sees each DNS query waits 5 seconds and then retries against a second server, because the primary DNS server is offline. Fixing the DNS server order cuts page loads from 6 seconds to under 1.
How it works
- Get permission and decide where to capture (your own PC, a SPAN port or a TAP).
- Optionally set a capture filter (BPF syntax, e.g. host 10.0.0.5) to record only relevant traffic.
- Reproduce the problem while capturing, then stop the capture.
- Apply display filters (e.g. tcp.port == 443) to narrow thousands of packets down to the interesting ones.
- Use features like Follow TCP Stream and Expert Information, then save the evidence as a .pcapng file.
Who uses it
Network engineers, security analysts, SOC teams, VoIP engineers and developers debugging network applications.
Key takeaway
Capture filters (BPF, e.g. port 53) decide what gets recorded; display filters (Wireshark syntax, e.g. dns) only hide or show what is already recorded. Only capture networks you own or are authorised to monitor.
Going deeper
- SPAN ports can drop packets when mirrored traffic exceeds the monitor port's speed and usually discard errored frames; a TAP copies everything at line rate, so prefer TAPs for evidence and security monitoring.
- On a switched network your PC sees only its own traffic plus broadcasts and multicasts; to see another host's conversation you need SPAN, a TAP or a capture on that host.
- Snap length and ring buffers keep captures manageable: tcpdump -s 128 records only headers, and tcpdump -C 100 -W 10 rotates ten 100 MB files so long captures never fill the disk.
- Wireshark's TCP analysis flags retransmissions, duplicate ACKs, zero windows and out-of-order segments, while Statistics > Conversations and I/O Graphs quickly show who used bandwidth and when.
- Most traffic is TLS-encrypted: captures still show handshakes, server names (SNI) and timing, but not content, unless you decrypt your own sessions in a lab using a key log file.
- Captures can contain passwords, personal data and session cookies, so get written authorisation, store pcaps encrypted and delete them when the investigation closes.
Common mistakes & misconceptions
- Typing a display filter as a capture filter: 'ip.addr == 10.0.0.5' fails in BPF, which needs 'host 10.0.0.5' instead.
- Capturing on the wrong interface, such as Wi-Fi instead of Ethernet or not the VPN adapter, then concluding the traffic never happened.
- Panicking about 'bad checksum' on outgoing packets; checksum offload means the NIC fills checksums after the capture point, so these warnings are usually harmless.
- Leaving a full-packet capture running for hours on a busy link, filling the disk and making the file too large to open.
Try it: Capture your own DNS traffic with tcpdump, then read it back
sudo tcpdump -i any -n port 53 -c 20 -w dns.pcap
tcpdump -n -r dns.pcap
# Wireshark display filters:
# dns
# http
# tcp.port == 443
# ip.addr == 192.168.1.10 && tcp.flags.syn == 1
Key protocols, devices, standards & tools
| Name | What it does | Example |
|---|---|---|
| Wireshark Wireshark Foundation (open source; created by Gerald Combs as Ethereal, 1998) · Software · Multi-layer · Current |
The world's most popular graphical packet analyzer, decoding thousands of protocols with colour-coding, filters and statistics. | Right-click a packet, choose Follow > TCP Stream, and read the full HTTP conversation between browser and server. |
| tcpdump The Tcpdump Group (uses libpcap) · Tool · Multi-layer · Current |
Command-line packet capture tool found on almost every Linux and BSD system, ideal for servers without a screen. | sudo tcpdump -i eth0 -n host 10.0.0.5 and port 443 -w web.pcap records HTTPS traffic to one server for later analysis. |
| TShark Wireshark Foundation · Tool · Multi-layer · Current |
Command-line version of Wireshark: same dissectors and display filters, usable in scripts and remote sessions. | tshark -r capture.pcapng -Y dns -T fields -e dns.qry.name lists every name looked up in a capture. |
| Capture filter (BPF) Berkeley Packet Filter syntax (libpcap) · Concept |
Rules applied while capturing so only matching packets are saved, keeping files small on busy links. | host 192.168.1.20 and not port 22 records one PC's traffic but skips your own SSH session. |
| Display filter Wireshark / TShark · Concept |
Rules applied after capture to show only matching packets; uses field names like ip.addr and tcp.port. | http.response.code >= 400 shows only failed web requests; tcp.analysis.retransmission highlights resent packets. |
| Common display filters Wireshark · Concept |
A handful of filters cover most beginner needs: protocol names, addresses, ports and TCP flags. | dns, http, arp, icmp, tls.handshake, tcp.port == 443, ip.addr == 10.1.1.1, tcp.flags.reset == 1. |
| Port mirroring / SPAN Switch vendors (SPAN is Cisco's name: Switched Port Analyzer) · Technology · Layer 2 · Current |
A switch feature that copies traffic from chosen ports or VLANs to a monitoring port where your analyzer is plugged in. | monitor session 1 source interface Gi1/0/5 and destination interface Gi1/0/24 copies a server's traffic to a laptop running Wireshark. |
| RSPAN / ERSPAN Cisco and other vendors · Technology · Multi-layer · Current |
Remote mirroring: RSPAN carries copied traffic over a special VLAN; ERSPAN tunnels it over IP (GRE) to a distant analyzer. | A branch switch sends mirrored traffic via ERSPAN to a central capture server at head office. |
| Network TAP Various vendors (e.g. Garland, Gigamon, Profitap) · Device · Layer 1 · Current |
Test Access Point: a hardware device inserted in a cable that copies every packet, including errors, without dropping any. | A bank places a passive fibre TAP on its internet link so the intrusion detection system sees 100% of traffic. |
| pcap / pcapng libpcap (pcap); pcapng documented by the IETF OPSAWG · Standard · Current |
File formats for saved captures. pcapng is newer and stores extra data like interface names and comments. | Ama attaches slow-dns.pcapng to the ticket so the vendor can open it in their own Wireshark. |
| Npcap Nmap Project · Software · Current |
Windows packet capture driver used by Wireshark and other tools; replaced the old WinPcap. | Wireshark's Windows installer offers to install Npcap so it can capture from your Wi-Fi and Ethernet adapters. |
| libpcap The Tcpdump Group · Software · Current |
The capture library underneath tcpdump, Wireshark and many security tools on Linux and macOS. | Tools like Zeek and Suricata use libpcap to read packets from an interface or a saved file. |
| Promiscuous / monitor mode Network adapter feature · Concept · Layer 2 |
Promiscuous mode lets a wired card capture frames not addressed to it; monitor mode does the same for raw Wi-Fi frames. | To see Wi-Fi beacons and probe requests, a lab laptop's adapter is put into monitor mode before capturing. |
| Network packet broker (NPB) e.g. Gigamon, Keysight (Ixia), cPacket · Device · Multi-layer · Current |
Aggregates feeds from many TAPs and SPAN ports, then filters, deduplicates and load-balances copies to monitoring and security tools. | A bank's packet broker sends only web traffic to the IDS and all VoIP traffic to the call-quality analyzer from the same TAPs. |
| TLS key log (SSLKEYLOGFILE) Supported by Firefox, Chrome and curl; read by Wireshark · Concept · Layer 7 · Current |
Environment variable that makes a client save TLS session secrets to a file so Wireshark can decrypt your own captured sessions. | In a lab, a student sets SSLKEYLOGFILE, browses a test site, loads the key file into Wireshark and reads the decrypted HTTP/2 requests. |
7.4 Performance & Speed Testing
Performance testing measures how fast and how smooth a network connection really is. The key numbers are bandwidth or throughput (how much data per second), latency (delay, in milliseconds), jitter (how much the delay varies) and packet loss. Good tools also test latency while the line is busy, because that is what makes video calls stutter.
Think of it like…
Throughput is how many lanes a motorway has, latency is how long the trip takes, and jitter is how unpredictable that trip time is from day to day.
Real-world example
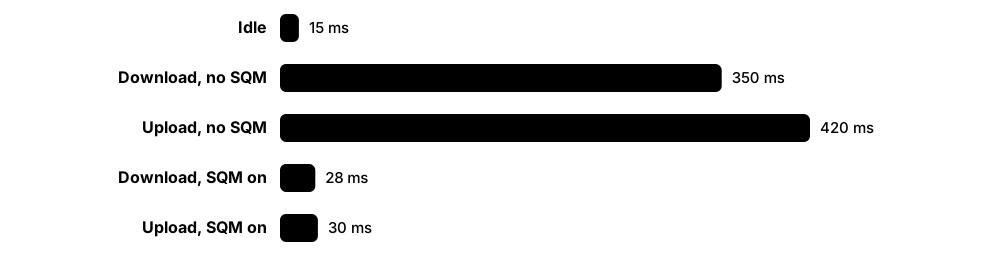
Kofi pays for 500 Mbps but complains of choppy video calls. Speedtest shows 480 Mbps down, so bandwidth is fine. A bufferbloat test shows idle latency of 15 ms jumping to 350 ms during a download, a grade D. Turning on SQM (smart queue management) in his router keeps loaded latency under 30 ms and the calls become smooth.
How it works
- Test on a wired connection first to rule out Wi-Fi problems.
- Measure idle latency, then latency under load (bufferbloat).
- Measure throughput to the internet (Speedtest, fast.com) or between two of your own hosts (iperf3).
- Repeat at different times of day and record the results.
- Use long-term tools (Smokeping, mtr) to catch intermittent problems.
Who uses it
Home users checking their ISP, help-desk staff, ISPs, network engineers validating new links, and VoIP/video teams.
Key takeaway
A speed test only measures the path to its test server; iperf3 between two of your own machines isolates your internal network from the internet.
Going deeper
- A single TCP stream is limited to roughly window size divided by RTT, so long-distance tests use parallel streams (iperf3 -P 8) or larger buffers, as RFC 6349's TCP throughput method describes.
- iperf3 UDP tests (-u -b 50M) send at a fixed rate and report jitter and loss, mimicking voice or video, whereas TCP tests show how fast a connection can actually go.
- Public speed tests choose a nearby server and open several parallel connections, so they measure your access link's capacity, not what one download from a distant site will achieve.
- Responsiveness metrics such as Apple's round trips per minute, Ookla's loaded latency and Cloudflare's quality scores capture what users feel during calls and games better than megabits per second.
- Carriers prove new circuits with standard tests: RFC 2544 benchmarks throughput, latency and frame loss per frame size, while ITU-T Y.1564 checks several service classes at once against the SLA.
- Active monitoring (IP SLA, TWAMP, Smokeping) sends synthetic probes all the time, while passive monitoring reads real traffic; together they show whether users are affected and why.
Common mistakes & misconceptions
- Testing over Wi-Fi from across the house and blaming the ISP; always repeat the test on Ethernet before raising a ticket.
- Comparing a speed test's Mbps with a download window's MB/s; divide megabits by 8 before deciding the line is slow.
- Running one test once; results vary by time of day, so record several measurements at peak and off-peak hours.
- Treating loss at a middle traceroute hop as real when later hops show none; routers often rate-limit replies addressed to themselves.
Try it: iperf3 between two machines in your own lab
# On the server (e.g. 192.168.1.50):
iperf3 -s
# On the client:
iperf3 -c 192.168.1.50 -t 10
iperf3 -c 192.168.1.50 -R      # reverse direction
iperf3 -c 192.168.1.50 -u -b 50M  # UDP: shows jitter and loss
# macOS 12+: built-in responsiveness test
networkQuality
Key protocols, devices, standards & tools
| Name | What it does | Example |
|---|---|---|
| iperf3 ESnet (Energy Sciences Network), open source · Tool · Layer 4 · Current |
Client-server tool that measures maximum TCP or UDP throughput between two hosts you control. Default port 5201. | iperf3 -c 10.0.0.20 shows 940 Mbit/s across a gigabit switch, proving the LAN is not the bottleneck. |
| Speedtest by Ookla Ookla (Ziff Davis) · Service · Layer 7 · Current |
Popular web and app speed test measuring download, upload, idle and loaded latency against a nearby server; has a CLI too. | speedtest (Ookla CLI) prints ping, jitter, download and upload so a technician can paste results into a ticket. |
| fast.com Netflix · Service · Layer 7 · Current |
Simple speed test that downloads from Netflix's own servers, showing speed similar to what streaming will get. | Open fast.com, then click 'Show more info' to see upload speed and loaded latency. |
| Cloudflare Speed Test Cloudflare (speed.cloudflare.com) · Service · Layer 7 · Current |
Browser test showing download, upload, latency, jitter and loaded latency, plus a network quality score for streaming, gaming and calls. | speed.cloudflare.com rates a connection 'Good' for streaming but 'Poor' for video calls because loaded latency is high. |
| M-Lab NDT (ndt7) Measurement Lab (open research platform) · Service · Layer 4 · Current |
Open, research-grade speed test whose results are published as open data; powers Google's search-results speed test. | Search 'speed test' in Google and click Run Speed Test: that runs M-Lab's NDT. |
| Smokeping Tobias Oetiker (open source) · Software · Layer 3 · Current |
Pings targets continuously and draws graphs where the 'smoke' shows latency spread and colours show packet loss. | A school's Smokeping graph shows loss every weekday at 15:30, when students stream video after lessons. |
| Bufferbloat test Bufferbloat.net community; tests by Waveform and others · Concept · Current |
Measures how much latency rises when the line is full. Big rises mean oversized buffers in modems or routers. | Waveform's test grades a connection A+ to F; fixing it often means enabling SQM (fq_codel or CAKE) on the router. |
| networkQuality Apple (macOS 12 and later) · Command · Layer 7 · Current |
Built-in Mac command measuring throughput and 'responsiveness' (round trips per minute under load). | networkQuality -v on a MacBook reports upload, download and responsiveness rated Low, Medium or High. |
| Throughput vs bandwidth Networking fundamentals · Concept |
Bandwidth is the link's maximum capacity; throughput is the real data rate achieved after overhead, congestion and errors. | A 1 Gbps Ethernet link typically shows about 940 Mbps of TCP throughput in iperf3 because of header overhead. |
| Performance baseline Operations practice (CompTIA Network+ objective) · Concept |
A record of normal latency, throughput, utilisation and error levels, so abnormal behaviour can be spotted and proven later. | Last month's baseline shows 40% WAN utilisation at 10:00; today's 95% proves something changed, not that 'it always feels slow'. |
| perfSONAR Open source (ESnet, GÉANT, Internet2, Indiana University) · Software · Multi-layer · Current |
Measurement toolkit that runs scheduled throughput, latency and loss tests between nodes, widely used on research and education networks. | Two universities run perfSONAR nodes at each campus edge and spot packet loss on a shared 100 Gbps research link before scientists notice. |
| IP SLA / TWAMP Cisco IP SLA; TWAMP is IETF RFC 5357 · Protocol · Layer 3 · Current |
Routers send synthetic probes to measure delay, jitter and loss continuously between sites; TWAMP is the open, multi-vendor standard. | An IP SLA probe every 30 seconds to the data centre raises an alert when jitter on the voice path exceeds 30 ms. |
| RFC 2544 & ITU-T Y.1564 IETF RFC 2544 (1999); ITU-T Y.1564 · Standard · Multi-layer · Current |
Standard test methods for benchmarking devices and activating carrier Ethernet services: throughput, latency, frame loss and SLA compliance. | Before handover, the ISP runs a Y.1564 test on a new 1 Gbps circuit and gives the customer a signed pass report. |
7.5 Network Monitoring & Observability
Monitoring means letting software watch your network 24/7 so you hear about problems before users do. Devices report health numbers (CPU, link usage, errors), traffic summaries and event logs to a central system, which draws graphs and sends alerts. Observability is the modern idea of collecting enough data to answer any 'why is it slow?' question, not just 'is it up?'.
Think of it like…
It is like a hospital's patient monitors: heart rate, oxygen and blood pressure are tracked continuously, and an alarm sounds the moment something drifts out of range.
Real-world example
A retailer's Zabbix server polls each store's router by SNMP every minute. At 09:12 it alerts that the Leeds store's WAN link is at 98% utilisation. NetFlow data shows one PC uploading backups to the cloud during opening hours. The team reschedules the backup to 02:00 and the card-payment slowdowns stop.
How it works
- Decide what matters: availability, utilisation, errors, latency, logs and flows.
- Enable data sources on devices: SNMP, syslog, NetFlow/IPFIX/sFlow or streaming telemetry.
- Send everything to a collector or monitoring platform.
- Build dashboards and set thresholds and alerts (e.g. link above 80% for 5 minutes).
- Review trends for capacity planning and tune alerts to avoid 'alert fatigue'.
Who uses it
Network operations centre (NOC) staff, network and systems engineers, managed service providers and SRE teams.
Key takeaway
Memorise ports: SNMP uses UDP 161 (polling) and UDP 162 (traps); syslog uses UDP 514. Use SNMPv3 because v1/v2c send community strings in clear text.
Going deeper
- Polling interval sets resolution: a 5-minute SNMP average hides a 30-second burst that saturates a link. Use 64-bit counters (ifHCInOctets) because 32-bit counters wrap in about 34 seconds at 1 Gbps.
- Utilisation = change in octets × 8 ÷ (interval in seconds × interface speed) × 100; tools do the maths, but knowing it helps spot a wrongly configured interface bandwidth.
- Flow records answer who, what and how much (addresses, ports, protocol, bytes, packets, timestamps) but never packet contents; sampling trades accuracy for scale on very fast links.
- Good alerting is symptom-based and actionable, such as 'link above 80% for 10 minutes' or 'site unreachable'; informational events belong on dashboards, not on the on-call engineer's phone.
- The SRE 'golden signals' of latency, traffic, errors and saturation map neatly onto network metrics: round-trip time, bits per second, interface errors and drops, and queue depth.
- Monitoring must itself be secured: SNMPv3 with authPriv, read-only views, ACLs on which hosts may poll, syslog over TLS and a management VRF or out-of-band network for collectors.
Common mistakes & misconceptions
- Leaving the default 'public' SNMP community enabled, letting anyone read device details; a writable community can even change the configuration.
- Not synchronising clocks with NTP, so logs from different devices cannot be lined up during an incident investigation.
- Alerting on everything, creating alert fatigue so the one critical page gets ignored; tune thresholds and silence alerts during maintenance windows.
- Checking only 'is it up?' with ping; a device can answer ping while dropping 5% of traffic on a congested uplink.
Try it: Query your own lab device with SNMP and send a test syslog message
# Read system description from your lab router (SNMPv2c, community 'public' in a lab only)
snmpget -v2c -c public 192.168.1.1 1.3.6.1.2.1.1.1.0
snmpwalk -v2c -c public 192.168.1.1 IF-MIB::ifDescr
# Write a test message to the local syslog
logger -p local0.info "test from lab"
Key protocols, devices, standards & tools
| Name | What it does | Example |
|---|---|---|
| SNMP IETF (SNMPv3: RFC 3411-3418, STD 62) · Protocol · Layer 7 · Current |
Simple Network Management Protocol: a manager polls devices for values (OIDs defined in MIBs) and devices send traps. UDP 161/162. | The monitoring server polls IF-MIB ifHCInOctets every minute to graph traffic on a switch uplink. |
| NetFlow / IPFIX Cisco NetFlow v9 (RFC 3954); IETF IPFIX RFC 7011 (replaced RFC 5101) · Protocol · Layer 3 · Current |
Routers summarise conversations (who talked to whom, which ports, how many bytes) and export flow records to a collector. | Flow data reveals that 40% of the WAN link is one user's cloud backup to 198.51.100.7. |
| sFlow sFlow.org (v5; RFC 3176 described v4) · Protocol · Layer 2 · Current |
Samples one in every N packets plus interface counters and sends them to a collector; light on switch resources. UDP 6343. | A data-centre switch samples 1 in 4,096 packets, enough to spot the top talkers on a 100 Gbps link. |
| Central log server (rsyslog / syslog-ng / Graylog) rsyslog and syslog-ng (open source); Graylog; messages follow syslog RFC 5424 · Software · Layer 7 · Current |
Collects syslog messages from every device into one searchable store, filtered by host, severity and time, with retention and alerts. | During an outage review, Graylog shows the core switch logged an interface flap three minutes before users started complaining. |
| Streaming telemetry / gNMI OpenConfig (gNMI over gRPC) · Protocol · Layer 7 · Current |
Devices push data to collectors every few seconds (or on change) instead of being polled, giving near real-time visibility. | A spine switch streams interface counters every 10 seconds via gNMI into Telegraf, InfluxDB and Grafana. |
| Zabbix Zabbix LLC (open source) · Software · Current |
Free, enterprise-grade monitoring for networks, servers and applications using SNMP, agents and templates. | Importing a vendor template lets Zabbix auto-discover every interface on a new switch and graph it. |
| Nagios Nagios Enterprises (Nagios Core is open source) · Software · Current |
Long-established up/down and service-check monitor with a huge plugin ecosystem; inspired forks like Icinga. | A check_ping plugin alerts the on-call engineer by email when a branch router stops answering. |
| PRTG Network Monitor Paessler · Software · Current |
Windows-based commercial monitor built around 'sensors' (one metric each), popular with small and mid-sized businesses. | An IT team adds SNMP traffic sensors and a ping sensor per site, getting a colour-coded map within an hour. |
| LibreNMS LibreNMS community (open source) · Software · Current |
Auto-discovering SNMP-based network monitor with graphs, alerts and support for thousands of device types. | Adding a core switch by IP makes LibreNMS discover its neighbours via LLDP and add them too. |
| SolarWinds NPM SolarWinds · Software · Current |
Commercial Network Performance Monitor widely used in enterprises for availability, NetPath path analysis and alerting. | A NOC wallboard shows every site's WAN link from SolarWinds NPM in green, amber or red. |
| Prometheus + Grafana Prometheus (CNCF project); Grafana Labs · Software · Current |
Prometheus scrapes and stores time-series metrics; Grafana turns them into dashboards. A cloud-native favourite. | snmp_exporter feeds router metrics to Prometheus, and a Grafana dashboard shows bandwidth beside app response times. |
| Datadog Cloud Network Monitoring Datadog (formerly Network Performance Monitoring, NPM) · Service · Current |
SaaS monitoring that maps traffic between hosts, containers and cloud services, plus network device monitoring. | A map shows the checkout service's calls to the payment API suffering TCP retransmits in one cloud region. |
| Cisco ThousandEyes Cisco (acquired ThousandEyes in 2020) · Service · Current |
Tests and visualises internet and cloud paths hop by hop from many vantage points, including ISPs you do not own. | ThousandEyes shows Microsoft 365 slowness is caused by loss inside a transit provider, not the company network. |
| Kentik Kentik · Service · Current |
SaaS network observability platform analysing huge volumes of flow, BGP and telemetry data; popular with ISPs. | An ISP uses Kentik to see which peers carry the most traffic and to detect a DDoS attack within minutes. |
| ntopng ntop (open source core) · Software · Current |
Web-based real-time traffic analyzer showing top hosts, applications and flows from a mirror port or flow exports. | ntopng on a SPAN port shows a smart TV is the top talker on a small office network. |
| SIEM e.g. Splunk (part of Cisco), Microsoft Sentinel, Elastic Security · Software · Current |
Security Information and Event Management: correlates logs, flows and alerts from many sources to detect attacks and support investigations. | The SIEM links five failed VPN logins with a firewall alert from the same IP address and opens an incident for the SOC. |
7.6 Network Automation & Programmability
Network automation means using scripts and tools to configure and check network devices instead of typing commands by hand on each one. Programmability means devices offer APIs (machine-friendly interfaces) so software can talk to them reliably. Automation saves time, avoids typos and makes every device configured the same way.
Think of it like…
Configuring 200 switches by hand is like writing 200 wedding invitations with a pen; automation is mail-merge: write the template once and print them all perfectly.
Real-world example
A university must change the NTP server on 300 switches. Engineer Lin writes a 20-line Python script with Netmiko that logs into each switch from an inventory file, applies two commands and saves the config. The job finishes in 12 minutes with a log for every device, instead of two days of manual work. The script is saved in Git for next time.
How it works
- Start with read-only tasks: collect show output or back up configs automatically.
- Store device inventory and variables in one place (a source of truth).
- Write templates (e.g. Jinja2) and push configs with Python, Ansible or NETCONF/RESTCONF.
- Keep everything in Git and peer-review changes.
- Test changes before deploying (Batfish, lab, CI/CD pipeline), then validate after.
Who uses it
Network engineers, network automation/DevNet engineers, cloud network teams and NetDevOps roles in medium to large organisations.
Key takeaway
Know the trio: NETCONF (RFC 6241, SSH port 830, XML), RESTCONF (RFC 8040, HTTPS, JSON or XML) and YANG (RFC 7950), the data-modelling language both use.
Going deeper
- Structured data beats screen-scraping: CLI output must be parsed with TextFSM, TTP or Genie, while NETCONF, RESTCONF and gNMI return data already structured by YANG models.
- YANG model families matter: IETF models such as ietf-interfaces are vendor-neutral, OpenConfig models are operator-driven and popular for telemetry, and native models expose every vendor-specific feature.
- NETCONF's candidate datastore and confirmed commit let you stage, validate and automatically roll back a change if the device loses contact, far safer than pushing CLI lines one by one.
- Idempotency is the key automation property: running the same playbook twice should change nothing the second time, because tools compare desired state with actual state before acting.
- Secrets such as device passwords and API tokens belong in a vault (Ansible Vault, HashiCorp Vault or CI secret stores), never hard-coded in scripts committed to Git.
- Start small and safe: read-only data collection, config backups and compliance reports deliver value quickly and build trust before automation is allowed to push changes.
Common mistakes & misconceptions
- Automating a messy, undocumented process; automation multiplies mistakes, so standardise configs and clean the source of truth first.
- Pushing a change to every device at once; deploy to a canary site first, then small batches, so a bad template breaks one site rather than three hundred.
- Storing passwords in plain text inside scripts or Git repositories, where they leak through backups, forks and screenshots.
- Trusting AI-generated configs or scripts without review and lab testing; plausible-looking output can contain wrong syntax or dangerous commands.
Try it: Netmiko: read the version from a lab switch (Python)
from netmiko import ConnectHandler

lab_switch = {
    "device_type": "cisco_ios",
    "host": "192.168.56.10",
    "username": "labuser",
    "password": "labpass",
}
with ConnectHandler(**lab_switch) as conn:
    print(conn.send_command("show version"))
Key protocols, devices, standards & tools
| Name | What it does | Example |
|---|---|---|
| Why automate NetDevOps practice · Concept |
Faster changes, fewer human errors, consistent configs, built-in documentation and easy rollback. | Most outages are caused by manual changes; a reviewed, tested template removes typos like a wrong VLAN number. |
| Python Python Software Foundation · Technology · Current |
The most common programming language for network automation, with libraries for SSH, APIs, parsing and templating. | A Python script reads a CSV of new branch offices and generates complete router configs from a Jinja2 template. |
| Netmiko Kirk Byers (open source Python library) · Software · Current |
Simplifies SSH connections to network devices from many vendors, handling prompts and paging for you. | conn.send_config_set(['ntp server 10.0.0.1']) pushes an NTP change to a Cisco, Juniper or Arista device. |
| NAPALM NAPALM open source project · Software · Current |
Python library giving one common API across vendors, e.g. get_facts() or config compare and replace. | get_interfaces() returns the same structured data from a Juniper and an Arista switch. |
| Nornir Nornir open source project · Software · Current |
Pure-Python automation framework that runs tasks across many devices in parallel using an inventory. | A Nornir script backs up 500 device configs in parallel using 50 threads. |
| Ansible Red Hat (open source, agentless) · Software · Current |
Automation tool using YAML playbooks; connects over SSH or APIs with no agent on devices; many network modules. | A playbook with the cisco.ios.ios_vlans module ensures VLAN 30 'Guests' exists on every access switch. |
| Terraform / OpenTofu HashiCorp, an IBM company (OpenTofu: Linux Foundation open source fork) · Software · Current |
Infrastructure as Code tool that declares desired resources and creates them through provider APIs; strong for cloud networking. | A Terraform file defines an AWS VPC, subnets and security groups; terraform plan previews changes before apply. |
| NETCONF IETF RFC 6241 (over SSH: RFC 6242) · RFC · Layer 7 · Current |
XML remote procedure calls over SSH (port 830) with candidate configs and commit; RESTCONF (RFC 8040) offers similar access over HTTPS. | An orchestrator sends <edit-config> to a candidate datastore, validates it, then commits it to the running config. |
| YANG IETF RFC 7950 (YANG 1.1; YANG 1.0 was RFC 6020) · RFC · Current |
Data-modelling language that defines the structure of configuration and state data for NETCONF, RESTCONF and gNMI. | The ietf-interfaces YANG model defines fields like name, description and enabled for every interface. |
| gNMI / gRPC OpenConfig (gNMI); gRPC from Google, now CNCF · Protocol · Layer 7 · Current |
gRPC Network Management Interface: fast binary protocol for config (Get/Set) and streaming telemetry (Subscribe). | gnmic subscribe streams interface counters from a lab switch every 5 seconds. |
| Git for configs Git (created by Linus Torvalds, 2005); hosted on GitHub, GitLab · Tool · Current |
Version control tracks every change to templates and configs: who, what, when and why, with easy rollback. | git diff shows a colleague changed an ACL line; git revert undoes it in seconds. |
| CI/CD for networks NetDevOps practice (GitLab CI, GitHub Actions, Jenkins) · Concept |
Automatic pipeline that lints, tests and deploys network changes when they are merged, like software releases. | A merge request triggers YAML linting, a Batfish check and a lab deploy before production is touched. |
| Batfish Open source (originally Intentionet; team joined AWS in 2022) · Software · Current |
Analyses device configs offline to predict behaviour: reachability, ACL effects and routing, without touching the network. | Batfish proves a new firewall rule still blocks the guest VLAN from reaching the finance servers. |
| AI assistants for network ops Various (e.g. GitHub Copilot, vendor AIOps tools) · Technology · Emerging |
AI helpers that explain configs, draft scripts, summarise logs and suggest fixes; outputs must be reviewed and tested by humans. | An engineer asks an assistant to draft an Ansible playbook, then reviews it and tests it in Containerlab first. |
| Jinja2 Pallets project (open-source Python templating) · Software · Current |
Templating language that fills variables, loops and conditions into text, used to generate consistent device configs from data. | The template line 'hostname {{ site }}-ACC-SW{{ num }}' produces LON-ACC-SW01 to SW40 from one inventory file. |
| pyATS / Genie Cisco (free Python test framework; Genie parser libraries) · Software · Current |
Test and validation framework that parses show commands into structured data and compares network state before and after changes. | Running pyats learn ospf before and after a change, then pyats diff, shows two OSPF neighbours went missing. |
7.7 Source of Truth, IPAM & Documentation
A source of truth is one trusted database that records what your network should look like: devices, IP addresses, VLANs, cables and sites. IPAM (IP Address Management) is the part that tracks which addresses are used and which are free. Good documentation means anyone on the team can find answers without guessing or interrupting a colleague.
Think of it like…
It is the library catalogue for your network: without it, finding which shelf (IP address or switch port) is free means walking every aisle.
Real-world example
A growing charity tracked IPs in an old spreadsheet, and two printers ended up with 10.20.1.50, causing random outages. They move to NetBox, import their subnets and devices, and require every new address to be reserved there first. Duplicate IPs stop, and new technicians can see every switch port and cable on day one.
How it works
- Choose one source of truth and agree that it wins over spreadsheets and memory.
- Import sites, racks, devices, subnets, VLANs and circuits.
- Adopt naming conventions so names explain location and role.
- Keep diagrams and automatic config backups up to date.
- Connect automation to the source of truth so configs are generated from it.
Who uses it
Network engineers, IT operations teams, data-centre staff, MSPs and anyone handing over a network to someone else.
Key takeaway
If it is not documented, it does not exist: update documentation as part of every change, not 'later'.
Going deeper
- Intended state lives in the source of truth and actual state lives on the devices; drift detection compares the two, and the team decides whether to fix the device or the record.
- IPAM good practice: allocate hierarchically by region, site and function, leave room to grow, record an owner and purpose for each prefix, and reconcile regularly with DHCP leases and ARP tables.
- DDI products combine DNS, DHCP and IPAM so a new lease automatically creates DNS records and appears in IPAM, removing manual spreadsheet updates and their typos.
- A complete documentation set includes physical, logical and rack diagrams, cable schedules, IP plans, baseline configs, standard operating procedures and contact details for vendors and circuits.
- Labelling standards such as ANSI/TIA-606 give every cable, port and rack a unique identifier at both ends, so the label, the database and the diagram all agree.
- NetBox exposes all data through REST and GraphQL APIs plus webhooks, letting automation read intent and update records, while its change log shows who edited what and when.
Common mistakes & misconceptions
- Keeping several 'truths' (spreadsheets, Visio files, NetBox) that disagree; choose one authority and generate or retire the others.
- Documenting once at project handover and never again; make record updates a required step in every change ticket.
- Storing passwords or SNMP community strings in diagrams and wiki pages that many people can read.
Try it: Query NetBox's REST API on your own instance for prefixes
curl -s -H "Authorization: Token $NETBOX_TOKEN" \
  -H "Accept: application/json" \
  http://netbox.lab.local/api/ipam/prefixes/?site=hq

# Example naming convention
# <site>-<role>-<number>:  LON-CORE-SW01, LON-ACC-SW12, NYC-FW01
Key protocols, devices, standards & tools
| Name | What it does | Example |
|---|---|---|
| Source of truth (SoT) NetDevOps practice · Concept |
The authoritative record of the intended network state, used by people and automation alike. | Automation reads switch port VLANs from NetBox and pushes them; manual edits on the switch are overwritten. |
| NetBox NetBox Labs (open source; created by Jeremy Stretch at DigitalOcean) · Software · Current |
Popular open-source DCIM and IPAM tool modelling sites, racks, devices, cables, IPs, VLANs and circuits with a REST/GraphQL API. | Clicking a switch port in NetBox shows the patch-panel cable and the server it connects to. |
| Nautobot Network to Code (open source, forked from NetBox in 2021) · Software · Current |
Source-of-truth and automation platform with apps for config compliance, golden configs and job running. | The Golden Config app compares each router's backup against its intended config and flags drift. |
| Infoblox Infoblox · Software · Current |
Enterprise DDI platform combining DNS, DHCP and IPAM in hardened appliances or cloud services. | A bank uses Infoblox so every DHCP lease automatically appears in IPAM and DNS. |
| phpIPAM phpIPAM open source project · Software · Current |
Free web-based IP address manager with subnet calculators, scanning for used addresses and an API. | phpIPAM's subnet view shows 10.30.0.0/24 is 72% used and the next free address is 10.30.0.185. |
| Device42 Device42 (part of Freshworks since 2024) · Software · Current |
Commercial discovery, CMDB, DCIM and IPAM tool that maps devices and application dependencies automatically. | Auto-discovery finds 40 undocumented servers and shows which applications depend on them. |
| IPAM IP Address Management · Concept |
Planning, tracking and managing IP address space and subnets to prevent conflicts and waste. | Before adding a camera, the technician reserves 10.50.2.31 in IPAM with a description and owner. |
| draw.io (diagrams.net) JGraph (free, open source) · Software · Current |
Free diagramming tool in the browser or desktop with network shape libraries; files can live in Git. | A student draws a lab topology with Cisco icons in draw.io and exports it as SVG for a report. |
| Microsoft Visio Microsoft · Software · Current |
Long-standing professional diagramming tool; many vendors publish official Visio stencils of their equipment. | An enterprise keeps its official physical and logical network diagrams as Visio files in SharePoint. |
| Lucidchart Lucid Software · Software · Current |
Cloud diagramming tool with real-time collaboration and import of cloud architectures (AWS, Azure). | Three engineers edit a data-centre diagram together during a design meeting. |
| Documentation set Operations practice (CompTIA Network+ objectives) · Concept |
The core documents every network needs: physical, logical and rack diagrams, cable maps, IP plans, baselines, SOPs and vendor contacts. | An engineer on call at 3 a.m. finds the rack diagram, the circuit ID and the ISP's support number on one wiki page. |
| Naming conventions Documentation practice · Concept |
Consistent device, port and cable names that encode location, role and number so they are self-explaining. | MAN-B2-ACC-SW03 = Manchester, building 2, access switch number 3. |
| Oxidized Open source (Ruby) · Software · Current |
Automatic config backup tool for 130+ device types, storing versions in Git with change notifications. | Oxidized pulls every router config hourly and emails a diff when someone changes an ACL. |
| RANCID Shrubbery Networks (open source) · Software · Legacy |
Really Awesome New Cisco confIg Differ: classic tool that backs up configs to version control and emails diffs. | An older ISP still runs RANCID nightly to keep a history of every router config. |
| Rack elevation diagram Documentation practice (Network+ objective); DCIM tools such as NetBox · Concept |
Front and rear drawing of each rack showing which device occupies which rack units (U), with power feeds and patching. | Before a remote-hands visit, the rack elevation shows the failed switch sits in rack B4, units 38-39, just above the patch panel. |
| Asset inventory & lifecycle (EOL/EOS) IT asset management practice; vendor end-of-sale and end-of-life notices · Concept |
Record each device's model, serial number, software version, support contract and end-of-sale/end-of-life dates to plan replacements. | The inventory flags 40 switches losing software support next year, so their replacement goes into this year's budget. |
7.8 Core Network Services Software
Behind every working network are a few quiet services: DNS turns names into addresses, DHCP hands out IP settings, NTP keeps clocks in sync, RADIUS checks who may connect, and TFTP moves small files to devices. Each service is provided by a piece of server software. Knowing the main products helps you build labs and understand real networks.
Which software runs which service
| Open source | Windows / commercial | |
|---|---|---|
| Authoritative DNS | BIND 9, PowerDNS | Windows DNS, Infoblox |
| Recursive DNS | Unbound, PowerDNS Recursor | Windows DNS forwarders |
| DHCP | ISC Kea, dnsmasq | Windows DHCP, Infoblox |
| Time (NTP) | chrony, ntpd | w32time |
| RADIUS | FreeRADIUS | Microsoft NPS, Cisco ISE |
| TFTP | tftpd-hpa, dnsmasq | Tftpd64 (free, Windows) |
Most services have a solid open-source option and a Windows or commercial one.
Think of it like…
These are the building's utilities: water, power and heating. Nobody notices them until one stops, and then nothing works.
Real-world example
A small makerspace runs a Raspberry Pi with dnsmasq for DHCP and local DNS, Pi-hole to block ad domains, and chrony to keep time. Laptops get 192.168.50.x addresses automatically, printer.lab resolves locally, and logs show correct timestamps. The whole setup costs under £80 and fits on a shelf.
How it works
- Choose DNS software: authoritative (answers for your domains) or recursive (looks up anything for clients), or both.
- Set up DHCP with scopes, gateway and DNS options, and reservations for printers and servers.
- Point all devices at reliable NTP sources so logs and certificates agree on time.
- Use RADIUS to authenticate Wi-Fi (802.1X), VPN and device-admin logins centrally.
- Run TFTP only on a trusted management network for firmware and config transfers.
Who uses it
System and network administrators, home-lab builders, ISPs and anyone running Linux or Windows Server infrastructure.
Key takeaway
ISC DHCP reached end of life in 2022; new deployments should use ISC Kea. Memorise ports: DNS 53, DHCP 67/68, NTP 123, RADIUS 1812/1813, TFTP 69 (all UDP, DNS also TCP).
Going deeper
- Run authoritative and recursive DNS as separate servers or instances: mixing the roles makes cache poisoning and open-resolver abuse easier, and the two workloads scale differently.
- Run at least two of everything critical: secondary DNS servers, a DHCP failover pair (Kea HA or Windows DHCP failover) and three or more NTP sources so one bad clock can be outvoted.
- DHCP relay (ip helper-address on Cisco) forwards client broadcasts to a central server, so one DHCP cluster can serve hundreds of VLANs across many sites.
- Accurate time matters beyond logs: Kerberos rejects tickets when clocks differ by more than five minutes by default, and TLS certificates look invalid when a device's clock is wrong.
- RADIUS can return attributes such as a VLAN ID or downloadable ACL after authentication, so a user's identity automatically places them in the right network segment.
- Never expose internal resolvers or TFTP servers to the internet: open resolvers are abused for DDoS amplification and TFTP has no authentication or encryption.
Common mistakes & misconceptions
- Running a single DNS or DHCP server; when it reboots for updates, the whole site seems 'down' even though the network is fine.
- Pointing domain-joined Windows PCs at public resolvers such as 8.8.8.8, which breaks Active Directory logons and internal name lookups.
- Setting device clocks by hand instead of using NTP, so they drift apart by minutes and incident timelines no longer line up.
Try it: Check your own resolver and time sync on Linux
dig example.com @127.0.0.1      # ask a local resolver (Unbound/dnsmasq)
chronyc tracking                 # how accurate is my clock?
chronyc sources -v               # which NTP servers am I using?
# Windows equivalent:
# w32tm /query /status
Key protocols, devices, standards & tools
| Name | What it does | Example |
|---|---|---|
| BIND 9 ISC (Internet Systems Consortium) · Software · Layer 7 · Current |
The classic, most widely deployed DNS server; can be authoritative, recursive, or both. Uses zone files. | A university hosts its uni.example zone on BIND 9 primary and secondary servers. |
| Unbound NLnet Labs · Software · Layer 7 · Current |
Fast, secure, validating recursive DNS resolver with DNSSEC and DNS-over-TLS support; default resolver in pfSense and OPNsense. | A home lab runs Unbound so all lookups are resolved and DNSSEC-validated locally. |
| PowerDNS PowerDNS (Open-Xchange) · Software · Layer 7 · Current |
Separate authoritative server and recursor products; authoritative can store zones in databases with an API. | A web host stores 50,000 customer zones in PowerDNS backed by PostgreSQL and edits them via API. |
| Windows Server DNS Microsoft · Software · Layer 7 · Current |
DNS role in Windows Server, tightly integrated with Active Directory and dynamic updates. | Domain-joined PCs register their own names in AD-integrated DNS so 'PC-ACC-014' resolves automatically. |
| dnsmasq Simon Kelley (open source) · Software · Layer 7 · Current |
Lightweight combined DNS forwarder, DHCP server and TFTP server, common in home routers and small labs. | dhcp-range=192.168.50.100,192.168.50.200,12h in dnsmasq.conf hands out 101 addresses with 12-hour leases. |
| Pi-hole Pi-hole open source project · Software · Layer 7 · Current |
Network-wide DNS sinkhole that blocks advertising and tracking domains for every device; often runs on a Raspberry Pi. | Pointing the router's DNS to the Pi-hole blocks ads even on smart TVs and phones. |
| ISC Kea ISC · Software · Layer 7 · Current |
Modern DHCPv4/DHCPv6 server with JSON configuration, REST API, database backends and high-availability support. | An ISP runs a Kea HA pair so customer leases survive the loss of one server. |
| Windows Server DHCP Microsoft · Software · Layer 7 · Current |
DHCP role in Windows Server with scopes, reservations, failover between two servers and PowerShell management. | Add-DhcpServerv4Reservation reserves 10.1.20.15 for the reception printer by its MAC address. |
| ISC DHCP (dhcpd) ISC · Software · Layer 7 · Obsolete |
Long-time standard open-source DHCP server; ISC ended maintenance in 2022 and recommends migrating to Kea. | An old Linux gateway still runs dhcpd; the team schedules a migration to Kea using ISC's migration tool. |
| chrony chrony open source project · Software · Layer 7 · Current |
Modern NTP client and server, default on many Linux distributions; syncs quickly and supports NTS security. | server time.cloudflare.com iburst nts in chrony.conf gives authenticated time using Network Time Security. |
| ntpd Network Time Foundation (NTP reference implementation; NTPv4 RFC 5905) · Software · Layer 7 · Legacy |
The original reference NTP daemon; still found widely, though many distributions now prefer chrony or ntpsec. | ntpq -p on an older server lists its upstream time sources and their offsets. |
| FreeRADIUS FreeRADIUS project (open source; RADIUS: IETF RFC 2865/2866) · Software · Layer 7 · Current |
The most widely used open-source RADIUS server for authenticating Wi-Fi, VPN and admin logins. UDP 1812/1813. | eduroam campus Wi-Fi often uses FreeRADIUS to check student credentials via 802.1X. |
| Microsoft NPS Microsoft (Network Policy Server) · Software · Layer 7 · Current |
Windows Server's RADIUS server, using Active Directory accounts and groups for network access policies. | NPS lets only members of the 'Staff-WiFi' AD group connect to the corporate SSID. |
| TFTP servers Protocol IETF RFC 1350; servers: tftpd-hpa, Tftpd64, dnsmasq · Software · Layer 7 · Current |
Trivial File Transfer Protocol servers (UDP 69) for firmware, configs and network boot (PXE); no authentication or encryption. | copy running-config tftp://192.168.56.5/sw1.cfg backs up a lab switch to a Tftpd64 server. |
| w32tm (Windows Time) Microsoft (Windows Time service) · Software · Layer 7 · Current |
Windows' built-in time service; domain members sync from domain controllers, and the PDC emulator should sync from reliable external NTP. | w32tm /query /status shows the time source and last sync; w32tm /resync forces an update after a firewall rule is fixed. |
7.9 Quality of Service (QoS)
Quality of Service is a set of techniques that give important traffic (like voice calls) priority over less urgent traffic (like file downloads) when a link is busy. Traffic is first sorted into classes and labelled, then each class is queued and sent according to rules. QoS cannot create bandwidth; it decides who goes first when there is not enough.
Common DSCP markings
| DSCP value | Typical traffic | |
|---|---|---|
| EF | 46 | Voice audio (RTP) |
| AF41 | 34 | Interactive video |
| AF21 | 18 | Business apps (ERP, CRM) |
| CS6 | 48 | Routing protocols |
| DF / CS0 | 0 | Best effort (default) |
| CS1 | 8 | Bulk / scavenger |
Typical values in the spirit of RFC 4594; each organisation documents its own policy.
Think of it like…
QoS is like an ambulance lane on a busy road: the ambulance (voice) gets through quickly while lorries (backups) wait a little longer.
Real-world example
A call centre's 50 Mbps internet link fills up every afternoon when updates download, and calls break up. The engineer marks voice packets as DSCP EF (46) and places them in a priority queue limited to 10 Mbps. Downloads are shaped into a lower class. Call quality stays clear even when the link is 100% busy.
How it works
- Classify: identify traffic types (by port, application, VLAN or existing marking).
- Mark: write a priority label into the packet (DSCP in the IP header, CoS in the 802.1Q tag).
- Trust or re-mark at the network edge so users cannot give themselves top priority.
- Queue and schedule: priority queue for voice, guaranteed bandwidth for business apps, best effort for the rest.
- Police or shape excess traffic and use WRED to avoid congestion collapse.
Who uses it
Enterprise network engineers, VoIP and video-conferencing teams, ISPs and anyone running real-time apps over busy links.
Key takeaway
Memorise: EF = DSCP 46 for voice; AF41 = DSCP 34 for interactive video; CS0/DF = 0 is best effort; CoS is 3 bits (0-7), DSCP is 6 bits (0-63).
Going deeper
- QoS only acts when a queue forms, typically where a fast LAN meets a slower WAN or internet uplink; on an uncongested 10 Gbps link, markings change nothing.
- Markings rarely survive the public internet because ISPs commonly reset or ignore DSCP, so end-to-end QoS needs a private WAN, an MPLS service with classes, or SD-WAN path selection.
- Shape outbound traffic slightly below the real ISP rate, around 95%, so the queue builds in your router, where your policy decides what waits, instead of in the ISP's buffer.
- Voice bandwidth depends on codec and overhead: G.711 with 20 ms packets needs about 87 kbps per direction on Ethernet, while G.729 needs about 31 kbps.
- A common design rule keeps the strict-priority queue at no more than about a third of link capacity, so priority traffic can never starve every other class.
- Wi-Fi has its own QoS: WMM maps DSCP values into four access categories that contend for airtime with different waiting times, so wired markings still matter on wireless.
Common mistakes & misconceptions
- Thinking QoS adds bandwidth; it only reorders and drops traffic during congestion, so a permanently overloaded link still needs an upgrade.
- Trusting markings from user PCs, which lets anyone mark downloads as EF; set the trust boundary at the phone or access switch.
- Putting too much traffic in the priority queue, such as all video plus voice on a small link, causing priority drops and starved classes.
- Confusing CoS and DSCP: CoS lives in the 802.1Q tag and is lost at a router, while DSCP travels in the IP header end to end.
Try it: Cisco MQC: mark voice and give it a priority queue (lab config)
class-map match-any VOICE
 match dscp ef
policy-map WAN-OUT
 class VOICE
  priority percent 20
 class class-default
  fair-queue
interface GigabitEthernet0/1
 service-policy output WAN-OUT
Key protocols, devices, standards & tools
| Name | What it does | Example |
|---|---|---|
| Why QoS Networking fundamentals · Concept |
Real-time traffic needs low delay, jitter and loss; QoS protects it during congestion on limited links. | ITU-T G.114 recommends under 150 ms one-way delay for good voice quality; QoS helps stay within it. |
| Classification & marking DiffServ model · Concept |
Classification identifies what traffic is; marking writes a label into the packet so later devices can act quickly. | An IP phone marks its voice packets EF, and the access switch trusts that mark from phones only. |
| DSCP IETF RFC 2474 · Standard · Layer 3 · Current |
Differentiated Services Code Point: 6 bits in the IP header's DS field, giving 64 possible values (0-63). | Wireshark shows 'DSCP: Expedited Forwarding (46)' on a Teams audio packet from a managed PC. |
| CoS (802.1p / PCP) IEEE 802.1Q (Priority Code Point, formerly 802.1p) · Standard · Layer 2 · Current |
Class of Service: 3 bits in the 802.1Q VLAN tag giving priorities 0-7 for frames on trunk links. | Voice frames on the voice VLAN carry CoS 5, matching DSCP EF at Layer 3. |
| DiffServ architecture IETF RFC 2475 (architecture); RFC 2474 (DS field) · RFC · Layer 3 · Current |
Scalable QoS model: packets are marked into classes and each router applies a per-hop behaviour (PHB) to each class. | Every router in the WAN gives EF packets the priority queue without keeping any per-call state. |
| IntServ / RSVP IETF RFC 1633 (IntServ); RFC 2205 (RSVP) · RFC · Layer 3 · Legacy |
Older QoS model reserving resources per flow along the path; precise but hard to scale, so DiffServ dominates. | RSVP-TE is still used in some MPLS networks to reserve bandwidth for traffic-engineered tunnels. |
| EF (Expedited Forwarding) IETF RFC 3246 · RFC · Layer 3 · Current |
Per-hop behaviour for low-loss, low-latency, low-jitter traffic; DSCP 46, used for voice. | SIP phones mark RTP audio EF so it goes into the low-latency queue. |
| AF (Assured Forwarding) IETF RFC 2597 · RFC · Layer 3 · Current |
Four classes (AF1x-AF4x), each with three drop precedences; higher second digit means dropped first in congestion. | AF41 (DSCP 34) for video calls; AF21 (DSCP 18) for business apps; AF23 dropped before AF21. |
| FIFO Queuing method · Concept |
First In, First Out: one queue, no priorities; the default on many fast interfaces. | On FIFO, a voice packet waits behind 200 queued download packets, adding noticeable delay. |
| WFQ / CBWFQ Queuing methods (Weighted Fair Queuing; Class-Based WFQ) · Concept |
WFQ shares bandwidth fairly between flows; CBWFQ guarantees a minimum bandwidth to each defined class. | CBWFQ guarantees the ERP class 30% of a WAN link even when backups try to take everything. |
| LLQ Low Latency Queuing (CBWFQ + strict priority queue) · Concept |
Adds a strict-priority queue to CBWFQ for voice/video, policed so it cannot starve other classes. | priority percent 20 sends voice first but caps it at 20% of the link. |
| Policing vs shaping Traffic conditioning · Concept |
Policing drops or re-marks traffic above a rate immediately; shaping buffers excess and sends it later, smoothing bursts. | An ISP polices a customer to 100 Mbps; the customer shapes outbound traffic to 95 Mbps to avoid those drops. |
| WRED Weighted Random Early Detection · Concept |
Drops a few low-priority packets early as a queue fills, making TCP senders slow down before the queue overflows. | WRED drops AF13 packets before AF11, protecting more important traffic in the same class. |
| QoS for voice and video Guidelines: IETF RFC 4594; ITU-T G.114 · Concept |
Voice needs low delay, jitter under about 30 ms and loss under 1%; video needs more bandwidth with similar limits. | A design reserves EF for voice, AF41 for video and makes sure total priority traffic stays under a third of the link. |
| Trust boundary QoS design practice · Concept · Multi-layer · Current |
The point where the network starts believing packet markings; traffic from untrusted devices is re-marked to safe values. | Access switches trust DSCP only from IP phones detected via CDP or LLDP-MED; a PC marking its downloads EF is reset to 0. |
| WMM (Wi-Fi Multimedia) Wi-Fi Alliance certification based on IEEE 802.11e · Standard · Layer 2 · Current |
Wi-Fi QoS with four access categories (voice, video, best effort, background) giving time-sensitive traffic a better chance at airtime. | A Wi-Fi phone's voice frames use the voice category, so they wait less for the air than a laptop's background file sync. |
7.10 Troubleshooting Methodology
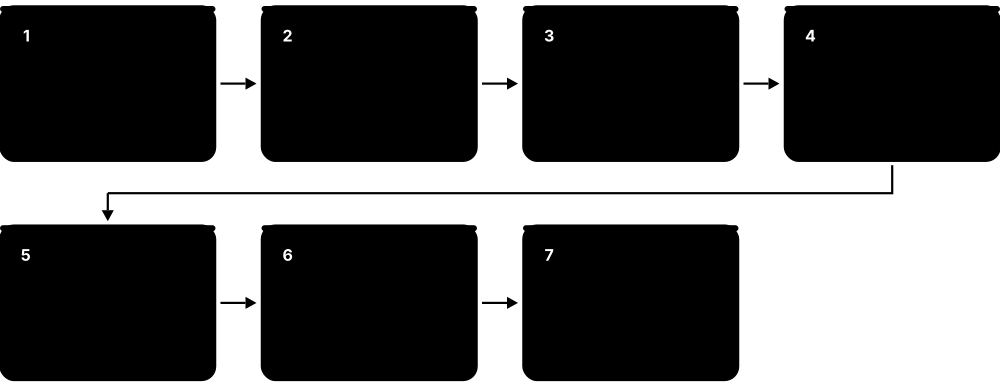
Troubleshooting is finding and fixing the cause of a network problem in an organised way rather than guessing. A methodology is a repeatable checklist so you don't skip steps, fix the wrong thing, or forget to write down what you did. Most problems are simple ones (a cable, a setting, DNS) once you look methodically.
Think of it like…
A good troubleshooter works like a doctor: ask about symptoms, form a likely diagnosis, run tests to confirm, treat, check the patient recovered, and write it in the notes.
Real-world example
Sales staff on the third floor cannot reach the CRM, while other floors can. Using divide and conquer, the technician pings the floor's gateway: no reply. The switch shows the uplink port in VLAN 1 instead of trunking VLAN 30 after a switch replacement last night. Correcting the trunk restores access; she verifies with users, documents the cause and adds the trunk config to the replacement checklist.
How it works
-
- Identify the problem: gather information, question users, find symptoms, check recent changes, duplicate it.
- 2-3. Establish a theory of probable cause, then test it (question the obvious; if wrong, form a new theory or escalate).
-
- Establish a plan of action and identify potential effects.
-
- Implement the solution or escalate as necessary.
-
- Verify full system functionality and implement preventive measures.
-
- Document findings, actions, outcomes and lessons learned.
Who uses it
Help-desk staff, field technicians, network and systems engineers, and anyone sitting CompTIA Network+ or A+.
Key takeaway
CompTIA asks the 7 steps in order; remember 'Identify, Theory, Test, Plan, Implement, Verify, Document', and always check 'what changed recently?' first.
Going deeper
- Ask scoping questions first: who is affected, since when, what changed, is it constant or intermittent, and can you reproduce it? One user versus a whole floor points to very different layers.
- Change correlation solves many incidents: check change tickets, config diffs from Oxidized or Git, and device logs from the hour before symptoms began before exploring exotic theories.
- Interface counters tell a story: rising CRC or FCS errors suggest cabling or interference, output drops suggest congestion, and late collisions on a full-duplex link indicate a duplex mismatch.
- Half-split testing finds faults fastest on long paths: test the middle point, then the half that fails, so a path of ten devices needs only about four tests.
- Escalate with evidence: a good ticket lists symptoms, timestamps, affected users, tests run with their output and what you have already ruled out, saving the next engineer hours.
- Intermittent problems need data over time: continuous ping or mtr, Smokeping graphs, logging and ring-buffer packet captures running until the fault reappears.
Common mistakes & misconceptions
- Changing several things at once; if the problem disappears you will not know which change fixed it or which one broke something else.
- Skipping verification with the user; the link may be up while the original application still fails for another reason.
- Assuming the latest change is innocent because 'it was tiny'; small ACL, VLAN or DNS edits cause a large share of outages.
- Not documenting the fix, so the same fault costs another engineer the same hours next month.
Try it: Bottom-up checks from a Windows PC in four commands
ipconfig /all              # L1-L3: link up? valid IP? gateway? DNS?
ping 192.168.1.1          # can I reach my gateway?
ping 1.1.1.1              # can I reach the internet by IP?
nslookup example.com      # does name resolution work?
Key protocols, devices, standards & tools
| Name | What it does | Example |
|---|---|---|
| CompTIA 7-step troubleshooting method CompTIA (Network+ N10-009 objectives) · Standard |
Identify, theorise, test, plan, implement or escalate, verify and prevent, then document lessons learned. | A Network+ question asks what to do after implementing a fix: answer 'verify full system functionality'. |
| Bottom-up approach OSI-based troubleshooting · Concept |
Start at Layer 1 (cables, lights) and work up through addressing, routing and applications. | No link light on the PC's port means stop there: test the cable before blaming DNS. |
| Top-down approach OSI-based troubleshooting · Concept |
Start at the application (Layer 7) and work down; good when lower layers obviously work. | Other websites load fine, so begin with the failing web app's settings and certificate. |
| Divide and conquer OSI-based troubleshooting · Concept |
Start in the middle (often Layer 3 with ping) and move up or down depending on the result. | Ping to the server works, so Layers 1-3 are fine; next check the service port and application. |
| Follow the path Troubleshooting technique · Concept |
Trace the traffic's route device by device from source to destination, checking each hop. | tracert stops after the branch firewall, so its rules and routes are examined next. |
| Duplex mismatch Common Layer 1/2 fault · Concept · Layer 2 |
One side runs full duplex and the other half; the link works but is slow with late collisions and CRC errors. | A server hard-set to 100/full facing an auto-negotiating switch port falls back to half duplex; set both to auto. |
| IP address conflict Common Layer 3 fault · Concept · Layer 3 |
Two devices share one IP address, causing intermittent connectivity and OS warnings. | A static printer at 10.0.0.50 sits inside the DHCP pool; exclude it from the scope or use a reservation. |
| DNS failure Common Layer 7 fault · Concept · Layer 7 |
Pings by IP work but names fail; caused by wrong DNS server settings, a down server or bad records. | ping 1.1.1.1 works but ping example.com fails, so nslookup reveals the DNS server is unreachable. |
| Wrong default gateway Common Layer 3 fault · Concept · Layer 3 |
The device reaches its own subnet but nothing beyond, because the gateway address is wrong or missing. | A PC set to gateway 192.168.1.254 when the router is .1 can print locally but cannot browse. |
| VLAN mismatch Common Layer 2 fault · Concept · Layer 2 |
A port is in the wrong VLAN, a VLAN is missing from a trunk, or native VLANs differ between switches. | show interfaces trunk shows VLAN 30 not allowed on the uplink, so the third floor is cut off. |
| MTU issues Common Layer 3 fault · Concept · Layer 3 |
Packets larger than a link's MTU are dropped when fragmentation is blocked; small pages load, big transfers hang. | ping -f -l 1472 example.com fails over a VPN but -l 1400 works, revealing a reduced tunnel MTU. |
| Switching loops Common Layer 2 fault (prevented by STP, IEEE 802.1D/802.1w) · Concept · Layer 2 |
A redundant cable without Spanning Tree causes broadcast storms that freeze the whole network within seconds. | A user plugs both ends of a patch cable into a desk switch; BPDU Guard shuts the port and saves the network. |
| Cable faults Common Layer 1 fault · Concept · Layer 1 |
Broken, crushed, badly terminated or too-long cables cause no link, slow speeds or rising error counters. | A cable tester shows pair 3-6 open on a crushed cable behind a filing cabinet. |
| Troubleshooting tools Field and software tools · Tool |
Cable tester, tone generator and probe, OTDR, Wi-Fi analyzer, protocol analyzer and command-line tools. | Use a toner to find the cable, a tester to check it, then ipconfig and ping to confirm the PC works. |
| Interface error counters show interfaces (Cisco), ip -s link (Linux), Get-NetAdapterStatistics (Windows) · Concept · Layer 2 |
Counters for CRC errors, input errors, drops, collisions and resets reveal physical faults, duplex problems and congestion on a port. | show interfaces Gi1/0/12 shows 48,000 CRC errors and rising, so the patch lead is replaced and the counter stops climbing. |
| Common wireless issues Common Layer 1/2 wireless faults · Concept · Layer 1 |
Weak signal, co-channel interference, wrong channel width, roaming problems and too many clients per AP cause slow or dropping Wi-Fi. | Meeting-room laptops show -78 dBm; adding an AP and narrowing channels from 80 to 40 MHz restores stable video calls. |
7.11 Network Cabling & Field Tools
Field tools are the hand tools and test devices technicians carry to build and repair the physical network: cutting and fitting cables, finding cables in walls, and proving that copper, fibre and Wi-Fi meet the required standard. Many network problems turn out to be physical, so these tools solve a lot of tickets.
Which field tool for which job
| Copper | Fibre | |
|---|---|---|
| Find the cable | Tone generator & probe | VFL red light |
| Check wiring | Wiremap verifier | Polarity check with VFL |
| Prove performance | Certifier (NEXT, loss) | Light source + power meter |
| Locate a fault | TDR distance-to-fault | OTDR trace |
| Prevent faults | Keep twists to the contact | Inspect and clean end-faces |
| Check a live port | Link tester (PoE, VLAN) | SFP optical power (DOM) |
Copper and fibre need different tools for the same questions.
Think of it like…
They are the electrician's toolbox for data: crimpers instead of pliers, testers instead of a voltmeter, and a toner instead of a stud finder.
Real-world example
Jordan is installing an office: he terminates Cat6 cables onto a patch panel with a punch-down tool and fits RJ45 plugs with a crimper. A basic tester shows one cable has pairs crossed. After fixing it, a Fluke certifier proves every run passes Cat6 limits, and the report goes to the client. In a corner office, a Wi-Fi analyzer shows a neighbour's network on the same channel, so he moves the access point to a clear one.
How it works
- Plan and pull cable, keeping under 100 m for copper Ethernet channels.
- Terminate: punch down at the patch panel/jack, crimp RJ45 plugs following T568A or T568B.
- Test continuity and wiring with a cable tester, or certify against the standard with a certifier.
- For fibre: inspect and clean connectors, use a VFL for breaks and an OTDR for long runs.
- Survey Wi-Fi with an analyzer to choose channels and AP locations.
Who uses it
Cabling installers, field technicians, data-centre staff, Wi-Fi engineers and help-desk staff who visit desks.
Key takeaway
'Inspect before you connect': a dirty fibre connector is the most common cause of fibre problems, so always inspect and clean first.
Going deeper
- Copper testers come in three tiers: verifiers check wiremap and continuity, qualifiers prove a link can carry a speed such as 1 or 10 Gb/s, and certifiers prove compliance with a TIA or ISO category.
- TIA fibre testing has two tiers: Tier 1 measures end-to-end loss with a light source and power meter, while Tier 2 adds an OTDR trace showing every connector and splice.
- OTDRs need a launch fibre, and ideally a receive fibre, of a few hundred metres so the first and last connectors fall outside the instrument's dead zone and can be measured.
- Common wiremap faults are opens, shorts, reversed pairs, crossed pairs and split pairs; split pairs pass simple continuity tests but fail certification because of crosstalk.
- Most SFP transceivers report digital optical monitoring (DOM): transmit and receive power in dBm, temperature and voltage, viewable with show interfaces transceiver, often saving a site visit.
- Wi-Fi tools differ: analyzers list visible networks, survey tools map coverage on floor plans, and spectrum analyzers reveal non-Wi-Fi interference such as microwave ovens, wireless cameras or Bluetooth.
Common mistakes & misconceptions
- Looking into a fibre end to check for light; invisible infrared lasers can damage eyes, so use a power meter or VFL instead.
- Assuming a continuity pass means the cable supports gigabit; split pairs and poor terminations need a qualifier or certifier to detect.
- Connecting fibre without inspecting both end-faces, transferring dirt to the mating connector and damaging expensive optics.
- Untwisting too much wire when terminating Cat6; keep pairs twisted to within about 13 mm (0.5 in) of the contacts to avoid crosstalk failures.
Try it: Check what the physical link negotiated and look at Wi-Fi channels
# Linux: link speed, duplex and error counters
ethtool eth0
ip -s link show eth0
# Windows: nearby Wi-Fi networks, signal and channel
netsh wlan show networks mode=bssid
Key protocols, devices, standards & tools
| Name | What it does | Example |
|---|---|---|
| Crimping tool Various manufacturers · Tool · Layer 1 |
Presses an RJ45 (8P8C) plug onto twisted-pair cable, pushing the contacts into each wire. | Jordan untwists minimal wire, follows T568B (orange-white first) and crimps a new patch cable. |
| Punch-down tool Various manufacturers (110 and Krone blades) · Tool · Layer 1 |
Pushes wires into insulation-displacement contacts on patch panels and keystone jacks and trims the excess. | Each Cat6 run is punched into the back of the patch panel using a 110 blade. |
| Copper tester tiers (verifier, qualifier, certifier) e.g. Fluke Networks (MicroScanner verifier, DSX certifier), Klein, NetAlly · Device · Layer 1 |
Verifiers check wiremap and length, qualifiers prove a link supports a given Ethernet speed, and certifiers prove compliance with a cable category. | A MicroScanner finds swapped pairs at one desk, while a DSX certification report proves 400 new runs meet Cat6A for the warranty. |
| Tone generator and probe (toner) Various (often called 'fox and hound') · Device · Layer 1 |
The generator puts a tone on a cable; the probe beeps when held near that cable, so you can find it in a bundle. | The technician clips the toner to a wall jack and finds the matching unlabelled cable at the patch panel. |
| Loopback plug Various · Device · Layer 1 |
Plug that sends a port's transmit signal back to its receive pins, testing the port without another device. | An RJ45 loopback plug makes a switch port light up, proving the port works and the fault is the cable. |
| Fibre test kit (scope, VFL, power meter, OTDR) Tier 1 and Tier 2 testing per ANSI/TIA-568; vendors such as EXFO, VIAVI, Fluke Networks · Device · Layer 1 |
Inspect and clean end-faces, find breaks with a red VFL, measure total loss with a power meter, and locate faults by distance with an OTDR. | Loss reads 6 dB against a 3 dB budget, so the technician shoots an OTDR trace and finds a bad splice 1.37 km away. |
| Multimeter Various · Device · Layer 1 |
Measures voltage, resistance and continuity; useful for PoE checks and power issues in racks. | The technician confirms a UPS outlet supplies 230 V before plugging in a new switch. |
| Wi-Fi analyzer apps e.g. WiFi Analyzer apps (Android, Windows), NetSpot · Software · Layer 1 |
Show nearby networks, signal strength (dBm), channels and overlap, helping pick the clearest channel. | The analyzer shows five networks on channel 6, so the AP is moved to channel 11 on 2.4 GHz. |
| NetSpot Etwok · Software · Layer 1 |
Wi-Fi survey and analysis tool for Windows and macOS that draws heatmaps of signal across a floor plan. | A walk-through survey heatmap reveals a dead zone in the meeting room, so another AP is added. |
| Ekahau Ekahau (part of Ookla) · Software · Layer 1 |
Professional Wi-Fi design and survey suite with a dedicated measurement device; an industry standard for enterprise Wi-Fi. | A hospital Wi-Fi engineer predicts coverage in Ekahau before installing, then validates it with an on-site survey. |
| inSSIDer MetaGeek · Software · Layer 1 |
Wi-Fi scanner showing networks, channel use and signal strength, popular with beginners and small businesses. | inSSIDer shows the office SSID using an 80 MHz channel overlapping a neighbour, so it is narrowed to 40 MHz. |
| Console cable RJ45-to-DB9 rollover, USB-to-serial and USB console cables · Cable · Layer 1 |
Connects a laptop to a device's console port for direct CLI access even with no IP configured; usually 9600 baud, 8N1. | A new switch has no IP address yet, so the technician uses a USB-to-RJ45 console cable and PuTTY at 9600 baud to configure it. |
| Spectrum analyzer e.g. Ekahau Sidekick 2; spectrum features in many enterprise APs · Device · Layer 1 |
Shows raw radio energy across a band, revealing non-Wi-Fi interference that ordinary Wi-Fi scanners cannot see. | The spectrum view shows a wide 2.4 GHz spike every lunchtime: the staff-room microwave oven next to the access point. |
| Network link tester e.g. NetAlly LinkRunner · Device · Multi-layer |
Handheld tester for live ports showing link speed, PoE power, the nearest switch and port via LLDP/CDP, VLAN and DHCP results. | At a dead desk socket, the tester shows switch port Gi1/0/22 in VLAN 99, so the port is moved to the staff VLAN. |
7.12 Network Change, Backup & High Availability Practices
This topic is about running a network safely: planning changes so they don't cause outages, keeping backups of every device's settings, and designing with spare parts and paths so one failure doesn't stop the business. It also covers how you get back in when the network itself is broken, and how you recover from a disaster.
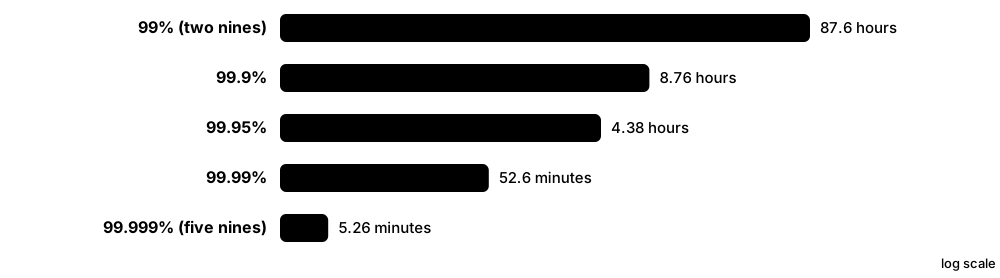
Think of it like…
It is like planning a house renovation: get the plan approved, do the noisy work when nobody's home, keep the old keys, have a spare generator, and know where the family meets if there's a fire.
Real-world example
A logistics company needs to upgrade its core switch firmware. The change is approved by the change board with a rollback plan and scheduled for Sunday 02:00-04:00. Configs are backed up first, and the redundant core pair is upgraded one switch at a time so traffic keeps flowing. When one switch fails to boot, the engineer reaches it through the console server and restores the previous image. Nobody in the warehouse notices.
How it works
- Raise a change request: what, why, risk, impact, test, implementation and rollback plan.
- Get approval (e.g. from a Change Advisory Board) and schedule a maintenance window.
- Back up configs and verify the backup before starting.
- Implement, verify, and roll back if checks fail.
- Design for failure: redundant devices, links and power, plus out-of-band access.
- Document the result and test disaster recovery plans regularly.
Who uses it
Network engineers, IT managers, change managers, data-centre and NOC teams, and auditors checking compliance.
Key takeaway
Always have a tested rollback plan, and remember the 3-2-1 backup rule: 3 copies, on 2 types of media, with 1 off-site.
Going deeper
- Availability can be estimated as MTBF ÷ (MTBF + MTTR): raise it with more reliable equipment (higher MTBF) or by recovering faster with spares, backups and runbooks (lower MTTR).
- ITIL change types: standard changes are pre-approved and low risk, normal changes go through assessment and approval, and emergency changes are fast-tracked but reviewed afterwards.
- Platforms offer safety nets: Junos and IOS XR commit confirmed, Arista EOS configuration sessions with commit timers, and Cisco IOS configure terminal revert timer all undo changes automatically unless confirmed.
- Disaster recovery sites trade cost for speed: a hot site mirrors production and takes over in minutes, a warm site needs data and configs restored, and a cold site is only space and power.
- Out-of-band networks usually combine a separate ISP or 4G/5G link, a management VRF and console servers, so engineers can reach devices even when routing or the firewall is broken.
- Test backups and failover regularly: a backup that has never been restored, or a redundant link never failed over, is an assumption rather than real protection.
Common mistakes & misconceptions
- Redundant devices sharing one hidden single point of failure, such as both core switches on one UPS or both ISP circuits in the same trench.
- Making 'quick' changes outside the change process during business hours; many outages trace back to unreviewed manual edits.
- Keeping config backups only on the device or in the same rack, so fire, theft or ransomware destroys every copy at once.
- Upgrading both members of a redundant pair at the same time, removing the very redundancy meant to keep traffic flowing.
Try it: Save and back up a lab Cisco config, with an automatic rollback safety net
copy running-config startup-config
copy running-config tftp://192.168.56.5/core1-before-change.cfg
show archive
! IOS safety net: auto-rollback in 10 minutes unless confirmed
configure terminal revert timer 10
! ... make change, test ...
configure confirm
Key protocols, devices, standards & tools
| Name | What it does | Example |
|---|---|---|
| Change management ITIL 4 'change enablement' practice · Concept |
A formal process to request, assess, approve, schedule and review changes so risks are understood beforehand. | A firewall rule change goes through a ticket with risk rating, peer review and a planned rollback. |
| Change Advisory Board (CAB) ITIL · Concept |
A group of stakeholders that reviews and approves significant changes and spots clashes between them. | The CAB delays a WAN change because the finance team is running month-end payroll that night. |
| Maintenance window Operations practice · Concept |
A pre-agreed, low-impact time slot when disruptive changes are allowed and users are warned. | Retail stores allow network changes only Sunday to Monday 01:00-05:00 when tills are closed. |
| Config backup Operations practice (tools: Oxidized, RANCID, vendor managers) · Concept |
Regular, automatic copies of every device's configuration, stored securely with version history. | A failed switch is replaced and its config restored from last night's backup within 20 minutes. |
| Golden config NetDevOps practice · Concept |
An approved standard configuration template; devices are checked against it to catch drift and errors. | A compliance report shows 12 switches missing the standard NTP and logging lines from the golden config. |
| Rollback plan Change management · Concept |
Exact, pre-written steps to undo a change if it fails, with a clear decision time to trigger it. | If users cannot log in by 03:00, restore the saved config and reload the previous firmware. |
| Redundancy design High-availability design · Concept |
Removing single points of failure with paired devices, first-hop redundancy (VRRP/HSRP), multiple links, diverse paths and dual ISPs. | Two core switches, dual uplinks from every access switch, and two ISPs on different cable routes. |
| UPS Various (e.g. APC by Schneider Electric, Eaton) · Device · Layer 1 |
Uninterruptible Power Supply: battery that keeps equipment running through power cuts and cleans up power spikes. | A rack UPS keeps the core and firewall running for 25 minutes until the building generator starts. |
| Out-of-band management Operations practice · Concept |
A separate path to manage devices (console, dedicated management network or cellular link) that works when production fails. | When a bad ACL locks everyone out, the engineer logs in through the out-of-band network and fixes it. |
| Console server e.g. Opengear, Lantronix, Cisco · Device · Layer 1 |
Device with many serial console ports, reachable remotely (often with 4G/5G backup), giving console access to every device. | From home, the engineer opens a console session to a router stuck in ROMMON through the console server. |
| Disaster recovery (RTO / RPO) Business continuity practice (e.g. NIST SP 800-34, ISO 22301) · Concept |
Plans to restore service after major failure. RTO is how fast you must recover; RPO is how much data you can lose. | RTO 4 hours, RPO 15 minutes: the DR site must be running within 4 hours with data no older than 15 minutes. |
| 3-2-1 backup rule Backup best practice · Concept |
Keep 3 copies of data, on 2 different media types, with 1 copy off-site (ideally one offline or immutable). | Configs live in Git on-site, are copied to a NAS, and synced to cloud storage in another region. |
| Post-implementation review ITIL / operations practice · Concept |
Checks after a change or incident whether it met its goals and what to improve next time. | A blameless review after a failed change adds a pre-check script to the standard procedure. |
| Single point of failure (SPOF) High-availability design · Concept |
Any one component whose failure stops the whole service: a lone firewall, one ISP circuit, a single power feed or one shared trench. | A design review finds both 'diverse' ISP circuits enter the building through one duct, so a second entry point is ordered. |
| MTBF / MTTR Reliability engineering · Concept |
Mean Time Between Failures measures how long equipment usually runs; Mean Time To Repair measures how quickly service is restored. | Keeping a spare, pre-configured switch on site cuts MTTR from a four-hour vendor dispatch to twenty minutes. |
| Hot, warm and cold sites Business continuity practice · Concept |
Disaster recovery locations ranked by readiness: hot sites run ready to take over, warm sites need restoring, cold sites offer only space and power. | A bank uses a hot site for card payments with an RTO of minutes, but a cold site for its archive systems. |