Chapter 8: Performance, Tools, Careers & Learning
Knowing how computers work becomes truly useful when you can measure them, make them faster and turn that skill into a career. This chapter covers fair benchmarking, the main benchmark suites, profiling tools and analysis methods, optimisation, power and cooling, and how to choose a PC or server. It finishes with careers, certifications, books, hands-on projects and model interview answers to take you from student to job-ready.
8.1 Benchmarking Basics & Pitfalls
A benchmark is a repeatable test that measures how fast a computer or program does a fixed job, so you can compare machines or check whether a change helped. Good benchmarking is surprisingly hard: results wobble from run to run, and a test that does not resemble your real work can point you in the wrong direction. The golden rule is to measure carefully, several times, under controlled conditions.
Think of it like…
Benchmarking is like timing runners: you need the same track, the same distance, a proper warm-up and several heats before you can say who is really faster.
Real-world example
Leon, an intern at a fictional video start-up called Clipwise, ran a compression test once on two laptops and declared laptop A 30% faster. His mentor made him repeat it ten times after a warm-up run, with both laptops plugged in and cooled. The median times were 41.2 s and 39.8 s, a gap of only about 3.5%, smaller than the run-to-run spread of 2-4%. The first result had been caused by laptop B indexing files in the background.
How it works
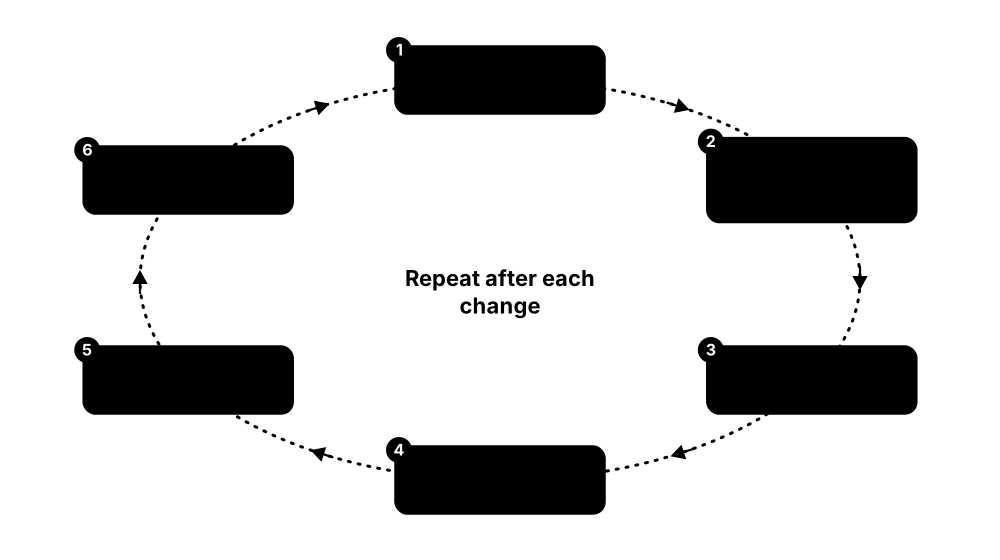
- Define the question and pick a workload that resembles real use.
- Fix the conditions: same software versions, power plan, temperature and background load.
- Do warm-up runs, then repeat the measurement many times and record every result.
- Report the median (or mean) with the spread, such as standard deviation or min-max.
- Compare with ratios and summarise several tests with a geometric mean, never a single cherry-picked number.
Who uses it
Hardware reviewers, performance engineers, HPC and cloud teams, and anyone deciding which machine or setting is genuinely faster.
Key takeaway
In interviews, mention warm-up, repetition, variance and representative workloads; it shows you know that one run proves nothing.
Going deeper
- Common noise sources: turbo and thermal state, background services, CPU frequency governors, memory-layout changes from ASLR, interrupts and busy SMT siblings. Experts pin threads, fix clock speeds and isolate cores for stable results.
- Report distributions, not single numbers: median and interquartile range resist outliers, and latency results should show p50, p95, p99 and maximum, ideally as a histogram or CDF plot.
- Optimising compilers can delete work whose result is never used or hoist it out of loops; harnesses provide helpers such as DoNotOptimize (Google Benchmark) and Blackhole (JMH) to prevent this.
- Summarise ratios with the geometric mean, as SPEC does; an arithmetic mean of ratios gives different answers depending on which machine you choose as the baseline.
- For load tests, constant-arrival-rate tools such as wrk2 and k6 avoid coordinated omission, whereas closed-loop tools that wait for each reply under-report latency during overload.
- Continuous benchmarking in CI catches regressions early, but needs dedicated quiet machines — shared cloud CI runners are too noisy for small differences.
Common mistakes & misconceptions
- Running a test once and trusting it — repeat it and report the spread.
- Benchmarking debug builds or with a profiler attached — measure optimised release builds under normal conditions.
- Comparing a laptop on battery with one on mains power, or hot with cold — fix and record power and thermal state.
- Averaging speed-up ratios arithmetically — use the geometric mean instead.
Try it: Time a function properly in Python with repeats and report median and spread
import timeit, statistics
t = timeit.repeat('sum(range(1_000_000))', repeat=10, number=5)
print(f'median {statistics.median(t):.4f}s  stdev {statistics.stdev(t):.4f}s  min {min(t):.4f}s')
Key chips, architectures, standards, tools & concepts
| Name | What it does | Example |
|---|---|---|
| Benchmark General performance engineering · Concept · Current · Beginner |
A standard, repeatable workload run to measure and compare the performance of hardware, software or configurations. | Running the same video export on three laptops and comparing the times is a simple benchmark. |
| Microbenchmark vs macrobenchmark General performance engineering · Concept · Current · Intermediate |
A microbenchmark times one tiny operation; a macrobenchmark times a whole realistic application or workload. | Timing one hash function is a microbenchmark; timing a full web request through the app stack is a macrobenchmark. |
| Warm-up run General performance engineering · Concept · Current · Beginner |
Discarded first runs that let caches fill, JIT compilers optimise and CPU clocks settle before real timing starts. | A Java service is run for 60 seconds before measuring, so the JIT has compiled hot methods. |
| Run-to-run variance Statistics · Metric · Current · Beginner |
The natural spread of results between identical runs, caused by background tasks, temperature, turbo behaviour and memory layout. | Ten runs of a render range from 52 to 55 seconds; any claimed gain under about 3 seconds is noise. |
| Median and percentiles Statistics · Metric · Current · Intermediate |
The median is the middle result; percentiles like p99 show the worst typical cases, which matter for latency. | An API averages 20 ms, but its p99 is 400 ms, so one request in a hundred feels slow. |
| Geometric mean Statistics; used by SPEC · Metric · Current · Intermediate |
The nth root of the product of n ratios; the fair way to combine speed-up ratios from several tests. | Speed-ups of 2x and 0.5x give a geometric mean of 1.0x, correctly showing no overall gain. |
| Representative workload General performance engineering · Concept · Current · Beginner |
A test that uses data sizes, access patterns and operations similar to the real job you care about. | A database team benchmarks with a copy of last month's real query log instead of a toy table. |
| Confidence intervals and significance Statistics · Metric · Current · Intermediate |
A range likely to contain the true result; if two configurations' intervals overlap heavily, the apparent difference may just be noise. | Build A takes 41.2 ± 0.9 s and build B 40.8 ± 1.1 s at 95% confidence — there is no real winner. |
| Throughput vs latency General performance engineering · Concept · Current · Beginner |
Report both: throughput (operations per second at full load) and latency at a stated load, because one number hides the trade-off. | Batching AI requests raises tokens per second but makes each user wait slightly longer for the first word. |
| Thermal and power state control General performance engineering · Concept · Current · Intermediate |
Laptop power plans, turbo boost and heat change clock speeds, so they must be fixed and recorded during tests. | A laptop scores 15% lower on battery than on mains power, so reviewers test both and label them. |
| Benchmarketing Industry slang · Concept · Current · Beginner |
Vendor charts that pick flattering tests, settings or scales so a product looks better than real-world use would show. | A slide shows a bar chart starting at 90 instead of 0, making a 4% lead look like double. |
| Coordinated omission Term popularised by Gil Tene · Concept · Current · Advanced |
A load-testing mistake where slow responses delay new requests, so the tool silently under-reports bad latency. | A tester switches to a constant-rate load generator and finds p99 latency is ten times worse than first reported. |
| Reproducibility record General performance engineering · Concept · Current · Intermediate |
Writing down hardware, firmware, OS, compiler, flags, settings and raw results so anyone can repeat the test. | Each result in a team spreadsheet lists BIOS version, kernel, gcc flags and the ten raw timings. |
| hyperfine and benchmark harnesses hyperfine (David Peter); Google Benchmark; JMH (OpenJDK); Criterion.rs; pytest-benchmark · Tool · Current · Intermediate |
Tools that handle warm-up, repetition and statistics for you, from whole commands (hyperfine) to single functions in C++, Java, Rust or Python. | 'hyperfine --warmup 3 ./old ./new' reports each command's mean and spread, and how many times faster the new build is. |
8.2 Benchmark Suites You Will Meet
Instead of inventing your own tests, you can use well-known benchmark suites that everyone recognises, so results can be compared across the world. Some target desktop users (Geekbench, Cinebench, 3DMark), some target servers and supercomputers (SPEC, HPL, STREAM) and some target AI systems (MLPerf). Each one measures something specific, so you must know what a score really means before trusting it.
Think of it like…
Benchmark suites are like standardised school exams: everyone sits the same paper, so marks can be compared, but a maths exam says nothing about how well you sing.
Real-world example
Aisha is choosing between two cloud server types for a fictional engineering firm, Ridgeway Analytics. She checks published SPEC CPU rate results for raw compute, runs STREAM to compare memory bandwidth, and uses fio to test the attached storage. One server wins SPEC by 12% but loses STREAM by 25%; because Ridgeway's simulations are memory-bound, she picks the second server.
How it works
- Decide what you care about: single-thread speed, multi-core throughput, graphics, memory, storage or AI.
- Pick the suite designed for that question and use its official rules and settings.
- Run it several times on an otherwise idle, well-cooled machine.
- Compare only scores from the same suite version, because new versions reset the scale.
- Cross-check with a test of your own real workload before spending money.
Who uses it
Reviewers, system buyers, cloud and HPC architects, chip vendors' marketing and engineering teams, and students comparing laptops.
Key takeaway
Never compare scores across versions: Geekbench 6 vs 7 or Cinebench 2024 vs 2026 numbers are on different scales.
Going deeper
- SPEC CPU 2017 contains 43 benchmarks in four suites — SPECspeed and SPECrate, each integer and floating point. 'Base' results require consistent compiler flags; 'peak' allows per-benchmark tuning.
- SPEC scores are ratios against a fixed reference machine, combined with a geometric mean; published results must follow the run rules and are reviewed before appearing on spec.org.
- MLPerf Inference defines scenarios — SingleStream, MultiStream, Server (latency-bounded queries) and Offline (batch throughput) — and 'closed' (same model and accuracy) versus 'open' divisions.
- STREAM's arrays must be much larger than all caches combined (the documented rule of thumb is at least four times), otherwise you measure cache rather than DRAM bandwidth; Triad is the figure usually quoted.
- fio essentials: direct=1 bypasses the page cache, iodepth sets queue depth, and SSDs should be preconditioned before testing random 4 KiB and sequential large-block patterns separately.
- Consumer suites use short runs that can miss throttling; Cinebench's 10-minute mode or looped 3DMark stress tests reveal sustained behaviour and cooling quality.
Common mistakes & misconceptions
- Comparing scores across versions or settings — Geekbench 6 vs 7, SPEC base vs peak and Cinebench 2024 vs 2026 are different scales.
- Treating one suite as 'overall speed' — each measures one type of workload.
- Trusting vendor-run results without reading the configuration — compiler flags, memory and power settings can swing scores widely.
Try it: Run quick, harmless CPU and storage benchmarks on Linux
sudo apt install sysbench fio
sysbench cpu --threads=4 run
fio --name=randread --rw=randread --bs=4k --size=256M --runtime=30 --time_based --filename=/tmp/fiotest
rm /tmp/fiotest
Key chips, architectures, standards, tools & concepts
| Name | What it does | Example |
|---|---|---|
| SPEC CPU 2017 SPEC (Standard Performance Evaluation Corporation) · Benchmark · Current · Intermediate |
Industry-standard suite of real compiled applications in four groups: integer and floating-point, each in 'speed' and 'rate' forms. | Server vendors publish SPECrate 2017_int_base results to show how much multi-core throughput a new dual-socket server offers. |
| SPEC CPU 2026 SPEC, released 5 May 2026 · Benchmark · Emerging · Intermediate |
The first new SPEC CPU suite in nine years: 52 benchmarks from 38 applications, adding areas such as EDA, databases and graph analytics. | New server CPU launches in 2026 begin quoting SPEC CPU 2026 rate scores alongside older SPEC CPU 2017 numbers. |
| SPECpower_ssj2008 SPEC · Benchmark · Current · Advanced |
Measures server energy efficiency by recording performance and power at load levels from idle to 100%. | A buyer compares overall ssj_ops per watt to estimate yearly electricity costs for 200 servers. |
| Geekbench 6 Primate Labs · Benchmark · Current · Beginner |
Cross-platform CPU and GPU benchmark with single-core and multi-core scores; widely quoted for phones and laptops since 2023. | A 2025 laptop review quotes Geekbench 6 single- and multi-core scores, comparable only with other Geekbench 6 results. |
| Geekbench 7 Primate Labs, released July 2026 · Benchmark · Emerging · Beginner |
New Geekbench version with AI, media and game-physics workloads, CUDA GPU support and a new scale not comparable to Geekbench 6. | A reviewer re-tests all laptops in Geekbench 7 rather than mixing old Geekbench 6 scores into the chart. |
| Cinebench 2024 and 2026 Maxon · Benchmark · Current · Beginner |
Free 3D rendering tests using the Redshift engine on CPU and GPU; 2026 adds an SMT test, and scores are not comparable with 2024. | PC builders run Cinebench multi-core for ten minutes to check both rendering speed and cooler performance. |
| 3DMark UL Solutions · Benchmark · Current · Beginner |
Gaming graphics benchmark suite; Steel Nomad succeeded Time Spy as its main modern rasterisation test. | A gamer runs 3DMark Steel Nomad before and after a driver update to check the GPU score. |
| PassMark PerformanceTest PassMark Software · Benchmark · Current · Beginner |
Windows-focused all-round suite testing CPU, 2D/3D graphics, memory and disks, with a large public results database. | An IT technician compares a staff PC's CPU Mark with the online chart before recommending an upgrade. |
| MLPerf Training MLCommons · Benchmark · Current · Advanced |
Measures how long systems take to train AI models to a target quality; v5.1 (late 2025) added Llama 3.1 8B and Flux.1. | A cloud provider shows its GPU cluster trains a reference language model in minutes rather than hours. |
| MLPerf Inference MLCommons; v6.0 published April 2026 · Benchmark · Current · Advanced |
Measures how fast systems run trained AI models, in data-centre and edge scenarios; v6.0 added GPT-OSS 120B and DeepSeek-R1 tests. | Chip makers compare tokens per second on Llama 2 70B and DeepSeek-R1 across GPU servers. |
| Running HPL and HPCG yourself ICL, University of Tennessee (HPL); HPCG project; optimised builds from NVIDIA, AMD and Intel · Benchmark · Current · Advanced |
Tune HPL's matrix size N to fill most memory, block size NB and process grid P × Q; run HPCG too, to see memory-bound reality. | A student cluster team reaches 75% of peak on HPL but under 3% on HPCG, and explains the gap in its report. |
| STREAM John D. McCalpin · Benchmark · Current · Intermediate |
Simple memory bandwidth test with Copy, Scale, Add and Triad kernels, reported in GB/s. | Triad shows a dual-socket server sustaining far higher bandwidth than a desktop with two DDR5 channels. |
| fio Jens Axboe, open source · Tool · Current · Intermediate |
Flexible I/O tester for disks and SSDs: choose read/write mix, block size, queue depth and threads. | An admin measures 4 KiB random-read IOPS on a new NVMe drive before putting a database on it. |
| sysbench Alexey Kopytov, open source · Tool · Current · Beginner |
Scriptable Linux benchmark for CPU, memory, threads, file I/O and MySQL-style database loads. | A student compares two cloud VM sizes with 'sysbench cpu run' to see value for money. |
| Phoronix Test Suite Phoronix Media (Michael Larabel), open source · Tool · Current · Intermediate |
Automated framework that downloads, runs and compares hundreds of open-source benchmarks, with results shared on OpenBenchmarking.org. | A Linux user runs the same test profile on two kernels to see whether an upgrade improved compile speed. |
8.3 Profiling & Monitoring Tools
A profiler shows where a program spends its time, so you can fix the slow part instead of guessing. Monitoring tools show what the whole machine is doing right now: how busy the CPU, memory, disks, network and GPU are. Together they turn 'it feels slow' into a clear picture of the real bottleneck.

Think of it like…
A profiler is like a fitness tracker for code that shows which exercise tires you most, while monitoring tools are the dashboard gauges of a car.
Real-world example
Tomás, a back-end developer at a fictional ticket site called Gatehouse, saw checkout requests take 900 ms. htop showed one CPU core pinned at 100%, so he ran 'perf record' and drew a flame graph. 70% of the time was spent re-parsing a config file on every request. Caching it once cut checkout time to 120 ms.
How it works
- Start broad with a monitor (htop, Task Manager, nvidia-smi) to see which resource is busy.
- Use a sampling profiler (perf, VTune, uProf, Instruments) to find the hottest functions.
- Visualise the call stacks, for example as a flame graph, to see which path is expensive.
- Drill into hardware counters or a GPU profiler (Nsight Systems, then Nsight Compute) if the hot spot is still unclear.
- Fix one thing, then measure again with the same tools to confirm the gain.
Who uses it
Software, performance, SRE, HPC, game and GPU engineers, plus sysadmins who must explain why a server is slow.
Key takeaway
Learn 'perf stat', 'perf record' and 'perf report' plus flame graphs; they appear in almost every Linux performance interview.
Going deeper
- Sampling profilers such as perf interrupt the program (for example 99 times per second per CPU) and record stacks with low overhead; instrumenting tools like gprof and Callgrind count every call but can slow programs dozens of times.
- Useful stacks need symbols and frame pointers: build with -g and -fno-omit-frame-pointer, or use DWARF or LBR unwinding. Fedora and Ubuntu 24.04 re-enabled frame pointers by default to make profiling easier.
- Hardware performance counters (cycles, instructions, cache and branch misses) come from the CPU's PMU; 'perf stat' reads them cheaply, and multiplexes when you request more events than there are counters.
- CPU profilers cannot see time spent waiting on locks, disk or network; off-CPU tools such as BCC's offcputime or wall-clock profilers reveal it.
- nvidia-smi 'utilisation' only means a kernel was running, not that the GPU's SMs were busy; DCGM and Nsight metrics such as SM occupancy and memory throughput show real efficiency.
- Modern observability combines metrics (Prometheus), logs, traces and profiles; OpenTelemetry, a CNCF project, standardises how traces, metrics and logs are collected.
Common mistakes & misconceptions
- Profiling a debug build — optimisation changes hot spots; profile release builds compiled with symbols.
- Reading 100% GPU utilisation as 'fully efficient' — it only means some kernel was running.
- Profiling too short a run or an unrealistic input — collect enough samples on a representative workload.
Try it: Profile a program with Linux perf and watch a GPU live
perf stat -e cycles,instructions,cache-misses ./prog     # counters + IPC
perf record -g ./prog && perf report                     # hottest functions
htop                                                     # live CPU/memory view
nvidia-smi dmon -s pucm                                  # GPU power, util, clocks, memory
Key chips, architectures, standards, tools & concepts
| Name | What it does | Example |
|---|---|---|
| Linux perf Linux kernel project (perf_events) · Tool · Current · Intermediate |
Built-in Linux profiler that reads hardware counters and samples call stacks to find hot code. | 'perf stat ./prog' shows instructions per cycle; 'perf record -g' then 'perf report' lists the slowest functions. |
| gprof GNU binutils · Tool · Legacy · Beginner |
Classic profiler: compile with -pg, run the program, and get a flat profile and call graph. | A student adds -pg to a C assignment and finds 80% of time in a bubble-sort function. |
| Valgrind (Memcheck, Callgrind, Cachegrind) Valgrind developers, open source · Tool · Current · Intermediate |
Runs programs on a simulated CPU to find memory errors, count instructions per function and model cache misses. | 'valgrind --tool=cachegrind ./prog' reveals a loop with a high cache miss rate from column-wise array access. |
| Intel VTune Profiler Intel (oneAPI toolkit) · Tool · Current · Advanced |
Free GUI and command-line profiler for hotspots, threading, memory access and top-down microarchitecture analysis on Intel CPUs and GPUs. | An HPC engineer uses VTune's memory-access view to show a solver is limited by DRAM bandwidth. |
| AMD uProf AMD · Tool · Current · Advanced |
AMD's free profiler for Ryzen and EPYC CPUs: time-based and counter-based sampling, power and thermal views. | A developer finds L3 cache misses dominating a hot loop on an EPYC server using uProf. |
| GPU profiling workflow (nsys, then ncu) NVIDIA Nsight Systems and Nsight Compute command-line tools · Tool · Current · Advanced |
Start with 'nsys profile' for the whole CPU-GPU timeline, then point 'ncu' at the one or two hottest kernels for detailed metrics. | A developer finds one softmax kernel takes 40% of GPU time; ncu then shows it is memory-bound with poorly coalesced loads. |
| Intel Advisor Intel (oneAPI toolkit) · Tool · Current · Advanced |
Analyses vectorisation, threading and memory access, and draws an automatic roofline chart of your loops on Intel CPUs and GPUs. | Advisor shows a hot loop sitting far below the memory roof because the compiler never vectorised it. |
| Apple Instruments Apple (part of Xcode) · Tool · Current · Intermediate |
macOS and iOS profiling app with templates for CPU time, allocations, energy, GPU and system traces. | An app developer uses the Time Profiler template to find a slow image-resize function on an M-series Mac. |
| Windows Performance Recorder and Analyzer Microsoft (Windows Performance Toolkit) · Tool · Current · Advanced |
Records detailed Event Tracing for Windows data and analyses CPU, disk, boot and driver delays. | A support engineer records a slow boot with WPR and finds a driver adding 20 seconds in WPA. |
| Language profilers (py-spy, cProfile, async-profiler) py-spy (open source); Python standard library; async-profiler (open source, Java) · Tool · Current · Intermediate |
Profilers that understand a language runtime, showing Python or Java functions rather than interpreter internals; py-spy attaches to running processes. | 'py-spy top --pid 4242' shows a slow web worker spending most of its time serialising JSON. |
| Continuous profiling (Grafana Pyroscope, Parca) Grafana Labs; Polar Signals (Parca); open source · Software · Current · Advanced |
Always-on, low-overhead sampling profilers that store fleet-wide profiles over time, so you can compare before and after each deployment. | After a release, continuous profiles show CPU time in a logging library doubled across 400 servers. |
| nvidia-smi NVIDIA driver tools · Command · Current · Beginner |
Command-line utility showing GPU utilisation, memory, temperature, power and running processes; 'dmon' streams live stats. | 'nvidia-smi dmon' shows a training job at 98% utilisation and 680 W, confirming the GPU is fully busy. |
| rocm-smi and amd-smi AMD ROCm · Command · Current · Intermediate |
Command-line tools reporting AMD GPU use, temperature, power and memory; amd-smi is the newer unified tool. | An admin checks every Instinct GPU in a node with amd-smi before starting a long job. |
| bpftrace and BCC tools Linux kernel; bpftrace and BCC projects · Tool · Current · Advanced |
Ready-made and one-line tracing tools, built on the kernel's eBPF engine, that measure latency, I/O and system calls in production with low overhead. | A one-line bpftrace script counts which processes open the most files on a busy server. |
| Flame graph Brendan Gregg (2011) · Format · Current · Intermediate |
Visualisation of sampled call stacks: each box is a function and its width shows how much time it used. | A wide 'json_parse' tower in a flame graph shows parsing is the main cost of a web request. |
| Prometheus and Grafana CNCF (Prometheus); Grafana Labs (Grafana) · Software · Current · Intermediate |
Prometheus scrapes and stores metrics over time; Grafana draws dashboards and alerts from them. | A cluster team graphs CPU, GPU temperature and job queue length for 300 nodes on one Grafana dashboard. |
8.4 Performance Analysis Methods
Performance analysis methods are step-by-step ways of thinking that stop you from wasting time on random fixes. They help you answer two questions: which resource is the bottleneck, and how much faster could things get if you fixed it. The first rule of all of them is simple: measure first, then optimise.
Think of it like…
It is like a doctor's examination: check vital signs in a fixed order before deciding on treatment, rather than guessing from one symptom.
Real-world example
Mei, an HPC engineer at the fictional Northvale Weather Centre, was asked to speed up a forecast model. Applying the USE method, she found memory bandwidth near saturation while CPU cores sat 40% stalled. A roofline plot confirmed the main kernel's arithmetic intensity was only 0.3 FLOP per byte, so faster cores would not help. Restructuring loops to reuse cached data raised intensity and cut run time by 35%.
How it works
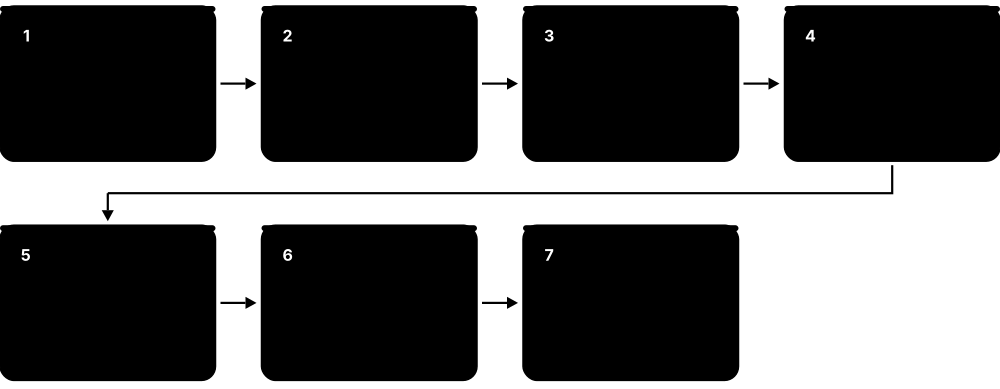
- Measure first: profile to find the hot spot that dominates run time.
- Check each resource for utilisation, saturation and errors (the USE method).
- Use Amdahl's law to estimate the best possible gain before investing effort.
- Place the hot kernel on a roofline chart to see if it is compute-bound or memory-bound.
- For CPU code, use top-down analysis to see whether the front end, back end or bad speculation is to blame.
Who uses it
Performance engineers, HPC specialists, SREs, compiler and CPU architects, and any developer handed a 'make it faster' ticket.
Key takeaway
Learn the USE checklist and the queueing knee: a resource at 90% utilisation already makes requests wait about ten times their service time, which is why healthy systems keep headroom.
Going deeper
- Gregg's 'Linux performance analysis in 60 seconds' uses commands such as uptime, dmesg, vmstat 1, mpstat -P ALL 1, pidstat 1, iostat -xz 1, free -m, sar -n DEV 1 and top for a fast first USE pass.
- Top-down level 1 splits pipeline slots into Retiring, Bad Speculation, Front-End Bound and Back-End Bound, with Back-End split into Memory-Bound and Core-Bound; 'perf stat --topdown' and VTune report it.
- Little's law (L = λW) holds for any stable system and drives capacity planning: 10,000 requests per second at 50 ms each means about 500 requests in flight at once.
- Characterise the workload first — who causes the load, which operations, what sizes and mix; many 'performance bugs' turn out to be unexpected load such as a bot or a retry storm.
- Tail at scale (Dean and Barroso, 2013): if a request fans out to 100 servers that are each slow 1% of the time, about 63% of requests hit at least one slow server.
- Amdahl's and Gustafson's laws, covered in earlier chapters, set the ceiling for any fix: estimate the possible gain before investing days of effort.
Common mistakes & misconceptions
- Optimising without a target — define the metric and what 'good enough' means first.
- Watching only averages — tail latency and saturation hide behind a healthy mean.
- Changing several things at once — you cannot tell which change helped or hurt.
- Assuming high CPU means the CPU is the problem — spinning locks and memory stalls also look like busy CPU.
Try it: The queueing knee and a roofline check in Python
S = 0.010                       # service time: 10 ms
for U in (0.5, 0.8, 0.9, 0.95):  # utilisation
    print(f'{U:.0%} busy -> response ~ {S/(1-U)*1000:.0f} ms')

peak_gflops, bw_gbs, ai = 2000, 200, 0.5   # ai = FLOP per byte
print('Roofline limit:', min(peak_gflops, bw_gbs*ai), 'GFLOP/s')
Key chips, architectures, standards, tools & concepts
| Name | What it does | Example |
|---|---|---|
| Measure first Performance engineering principle · Concept · Current · Beginner |
Profile before changing code, because intuition about where time goes is usually wrong. | A team expected database calls to be slow, but profiling showed logging was taking half the request time. |
| Hot spot Performance engineering · Concept · Current · Beginner |
A small part of the code where most of the run time is spent; fixing it gives the biggest gain. | One sorting function uses 65% of CPU time, so the team optimises it before anything else. |
| Bottleneck General · Concept · Current · Beginner |
The single most limited resource, which caps the speed of the whole system. | A fast GPU training job is limited by a slow network drive feeding it images. |
| Utilisation and queueing (the knee) Queueing theory (M/M/1 model) · Concept · Current · Intermediate |
As a resource nears 100% busy, waiting explodes: in a simple queue, response time ≈ service time ÷ (1 − utilisation). | At 50% utilisation a 10 ms disk request averages 20 ms; at 90% it averages about 100 ms. |
| Off-CPU analysis Brendan Gregg; BCC offcputime · Concept · Current · Advanced |
Measuring where threads wait — on locks, disk, network or sleep — because CPU profiles only show time spent running. | A slow API shows little CPU use; off-CPU analysis reveals 80% of each request is spent waiting for a database connection. |
| USE method Brendan Gregg · Concept · Current · Intermediate |
For every resource, check Utilisation, Saturation and Errors to find bottlenecks quickly and systematically. | Checking the disk shows 100% utilisation and a long queue (saturation), revealing the I/O bottleneck. |
| RED method Tom Wilkie (Grafana Labs) · Concept · Current · Intermediate |
For services, monitor Rate of requests, Errors and Duration (latency). | A microservice dashboard shows requests per second, error percentage and p99 latency side by side. |
| Roofline model Williams, Waterman and Patterson (2009); built into Intel Advisor and Nsight Compute · Concept · Current · Advanced |
Diagnostic chart: plot each kernel's measured FLOP/s against its FLOPs per byte to see how far below the compute or memory roof it sits. | Nsight Compute's roofline places a kernel at 30% of the memory roof, so the fix is better memory access, not more maths. |
| Regression bisection git bisect; continuous benchmarking · Concept · Current · Intermediate |
Finding the exact change that made things slower by benchmarking builds halfway between a known-good and a known-bad version, repeatedly. | An automated git bisect pinpoints the commit that slowed builds 15% among 100 commits in about seven steps. |
| Top-down microarchitecture analysis (TMA) Ahmad Yasin, Intel (2014) · Concept · Current · Advanced |
Splits CPU pipeline slots into Retiring, Front-end bound, Back-end bound and Bad speculation to locate stalls. | VTune shows 60% back-end bound, memory-bound, so the fix is better data layout, not fewer branches. |
| IPC (instructions per cycle) CPU performance counters · Metric · Current · Intermediate |
Instructions completed per cycle, read from hardware counters; a quick health check where low values suggest stalls, often on memory. | 'perf stat' reports IPC of 0.4, suggesting cache misses rather than heavy computation. |
| Little's law John Little (1961) · Concept · Current · Intermediate |
Items in a system equal arrival rate times time spent: L = lambda x W. | A server handling 500 requests/s at 0.2 s each has about 100 requests in progress at once. |
| Tail latency Performance engineering · Metric · Current · Intermediate |
The slowest few per cent of response times (p99, p99.9), which users notice and big systems amplify. | A page calling 50 services is slowed by whichever one hits its p99 delay. |
| Scalability testing HPC and cloud practice · Concept · Current · Advanced |
Measuring speed-up as you add cores or nodes (strong scaling) or grow work with resources (weak scaling). | A code speeds up 7x on 8 nodes but only 9x on 32, so communication now dominates. |
8.5 Optimisation Basics
Optimisation means making a program use less time, memory or energy while giving the same answers. The biggest wins usually come from a better algorithm, then from arranging data so the CPU's caches and vector units are used well, and only then from compiler flags, parallel threads or a GPU. Always keep a correct, measured baseline so you know each change really helped.
Think of it like…
Optimising is like planning a supermarket trip: choosing the right shop (algorithm) matters most, then a sensible route down the aisles (memory layout), and only then walking faster (compiler tricks).
Real-world example
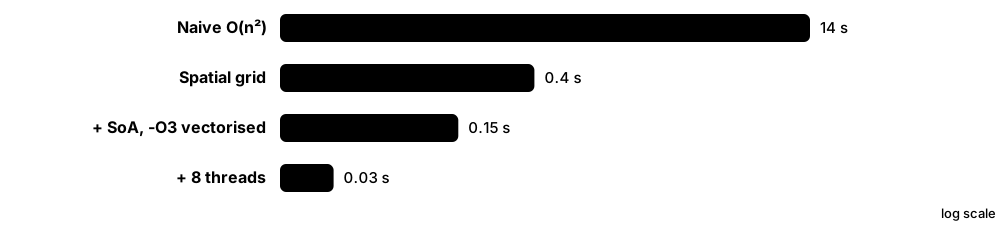
Kofi, a student at a fictional robotics club, had a collision checker that compared all 20,000 objects with each other: 200 million pairs, taking 14 s. Switching to a spatial grid cut checks to about 300,000 and time to 0.4 s. Storing positions as separate x, y and z arrays (SoA) and compiling with -O3 -march=native let the compiler vectorise the loop, dropping time to 0.15 s. Adding OpenMP across 8 cores brought it to 0.03 s.
How it works
- Measure a correct baseline and find the hot spot.
- Improve the algorithm and data structures first (lower big-O complexity).
- Make memory access cache-friendly: contiguous arrays, sequential access, tiling, SoA layout.
- Let the compiler help: -O2/-O3, -march=native, then PGO and LTO, and check its vectorisation report.
- Parallelise with threads or OpenMP, avoiding false sharing, and offload suitable work to a GPU.
- Re-measure after every change and keep tests to prove results are still correct.
Who uses it
Software, game, HPC, embedded, quant-finance and ML engineers, and compiler developers.
Key takeaway
Say 'algorithm first, then memory, then parallelism' in interviews, and quote Knuth: premature optimisation wastes effort when you have not measured.
Going deeper
- Typical order of wins: algorithms and data structures (often 10-1000×), memory layout and locality (2-10×), vectorisation (up to the SIMD width, e.g. 8 floats with AVX2) and threads (up to the core count).
- -O2 is the usual release default; -O3 adds more aggressive inlining and vectorisation. -march=native, or a level such as x86-64-v3, enables AVX2 — ship builds targeting the oldest CPUs you support.
- PGO plus LTO commonly gives several to around 15 per cent on large, branchy programs such as browsers, compilers and databases; post-link optimisers like LLVM BOLT can add more by reordering hot code.
- Swapping the default malloc for jemalloc or mimalloc can speed up allocation-heavy multithreaded servers and reduce memory fragmentation.
- Data-oriented design, popular in game engines, organises data by how it is processed, giving contiguous arrays that suit caches and SIMD.
- Guard correctness: keep unit tests and golden outputs, allow tolerances when floating-point order changes, and run sanitizers (ASan, UBSan, TSan) after risky optimisations.
Common mistakes & misconceptions
- Micro-optimising before profiling — the slow code is rarely where you guess.
- Using -ffast-math or -march=native blindly — results or portability can change silently.
- Hand-writing what a library already does — tuned BLAS and FFT libraries are very hard to beat.
- Testing only one input size — caches change the picture between small and large inputs.
Try it: Ask GCC which loops it vectorised
gcc -O3 -march=native -fopt-info-vec-optimized -o saxpy saxpy.c
# saxpy.c: for (int i = 0; i < n; i++) y[i] = a * x[i] + y[i];
# output like: saxpy.c:5:21: optimized: loop vectorized using 32 byte vectors
Key chips, architectures, standards, tools & concepts
| Name | What it does | Example |
|---|---|---|
| Algorithmic complexity (big-O) Computer science theory · Concept · Current · Beginner |
Describes how work grows with input size; moving from O(n^2) to O(n log n) beats any micro-tuning. | Replacing a nested-loop duplicate search with a hash set turns minutes into milliseconds on a million rows. |
| Cache-friendly access CPU memory hierarchy · Concept · Current · Intermediate |
Touching memory sequentially and reusing data while it is still in cache, instead of jumping around randomly. | Looping over a C matrix row by row runs several times faster than column by column. |
| AoS vs SoA Data-oriented design · Concept · Current · Intermediate |
Array of Structures stores whole objects together; Structure of Arrays stores each field in its own array, helping vectorisation. | A particle simulation keeps x[], y[] and z[] arrays so SIMD can update eight positions at once. |
| Loop tiling (blocking) Compiler and HPC technique · Technology · Current · Advanced |
Processing data in small blocks that fit in cache, so each block is reused many times before eviction. | Blocked matrix multiplication with 64x64 tiles runs much faster than the naive triple loop. |
| Vectorisation (SIMD) Intel/AMD AVX2 and AVX-512; Arm NEON and SVE · Technology · Current · Intermediate |
Getting loops onto SIMD units: write simple, contiguous loops, then read the compiler's vectorisation report before resorting to intrinsics. | With AVX2, one instruction adds eight 32-bit floats, speeding up an audio filter loop. |
| Optimisation flags -O2, -O3, -march=native GCC and Clang · Command · Current · Beginner |
-O2/-O3 enable progressively more optimisations; -march=native targets the build machine's own instruction set extensions. | A physics code built with -O3 -march=native runs 30% faster, but may not run on older CPUs. |
| -ffast-math GCC and Clang · Command · Current · Advanced |
Relaxes strict IEEE 754 floating-point rules for speed, which can change results slightly or break NaN handling. | A team enables it for a game's particle effects but not for its financial maths library. |
| PGO (profile-guided optimisation) GCC, Clang, MSVC · Technology · Current · Advanced |
Build once with instrumentation, run typical workloads, then rebuild using the recorded profile to optimise hot paths. | A browser team uses PGO and sees several per cent faster page loads with no code changes. |
| LTO (link-time optimisation) GCC, Clang, MSVC · Technology · Current · Intermediate |
Optimises across source files at link time, enabling inlining and dead-code removal across the whole program. | Adding -flto shrinks a command-line tool's binary and makes it slightly faster. |
| Compiler choice: GCC, Clang/LLVM, ICX, AOCC GNU; LLVM project; Intel oneAPI; AMD · Software · Current · Intermediate |
Different compilers optimise differently; vendor compilers such as Intel ICX and AMD AOCC are tuned for their own CPUs. | An HPC centre tests a solver with GCC, Clang and ICX and keeps whichever is fastest. |
| Avoiding allocations and copies General optimisation practice · Concept · Current · Intermediate |
Reusing buffers, reserving capacity and passing references instead of copying large objects removes hidden allocator and memory-bandwidth costs. | Calling reserve(n) on a C++ vector before a loop avoids repeated reallocations and cuts a parser's run time by a quarter. |
| Optimised maths libraries (OpenBLAS, oneMKL, FFTW) OpenBLAS project; Intel oneMKL; FFTW (MIT); AMD AOCL · Software · Current · Intermediate |
Hand-tuned libraries for linear algebra and FFTs that beat home-written loops by large factors on modern CPUs. | Replacing a triple-loop matrix multiply with one BLAS dgemm call makes it tens of times faster on the same laptop. |
| GPU offload CUDA, ROCm/HIP, SYCL, OpenMP target · Concept · Current · Intermediate |
Moving large, highly parallel work to a GPU, keeping data on the device to avoid slow transfers. | A lab moves its matrix maths to CuPy on a GPU and cuts a 20-minute analysis to 40 seconds. |
| Caching and precomputation Memoisation; lookup tables; batching · Concept · Current · Beginner |
Computing an expensive result once and reusing it — memoised functions, lookup tables, batched I/O — instead of repeating the work. | Parsing a configuration file once at start-up, rather than on every request, removes 70% of a web request's CPU time. |
8.6 Power, Thermals & TDP
Every chip turns the electricity it uses into heat, and if that heat is not removed the chip slows itself down to stay safe. TDP and related power limits tell you roughly how much heat a cooler must handle and how hard a processor is allowed to boost. Performance per watt, how much work you get for each unit of energy, now matters as much as raw speed, from phones to AI data centres.
Think of it like…
A processor is like a sprinter: it can run flat out for a short burst (turbo), but over a long race it must settle to a pace its body can cool (sustained power).
Real-world example
Ravi's fictional design studio, Lumen & Line, bought two identical workstations, but one rendered 18% slower. Monitoring showed its CPU hitting 100 °C and throttling because the cooler had been fitted without enough thermal paste. After re-seating the cooler, temperatures fell to 82 °C and clocks held steady. The studio then capped package power at 200 W instead of 250 W, losing only about 4% speed while cutting noise noticeably.
How it works
- The chip draws power; almost all of it becomes heat in a very small area.
- The firmware allows short bursts above the sustained limit (turbo) while temperature and current permit.
- Heat moves through the heat spreader and thermal paste into a heatsink, liquid loop or cold plate.
- Fans or pumps carry heat away into the room air or, in data centres, into facility water.
- If temperature or power limits are reached, clocks drop (throttling) to protect the chip.
Who uses it
PC builders, laptop designers, data-centre and HPC engineers, chip power architects and anyone sizing cooling or power supplies.
Key takeaway
Remember that TDP is a cooling guideline, not the maximum power draw; modern CPUs and GPUs can exceed it briefly.
Going deeper
- Dynamic power ≈ C × V² × f. Because voltage must rise with frequency, the last few hundred MHz cost disproportionate power — which is why modest undervolts or power caps lose little performance.
- Intel lists Processor Base Power and Maximum Turbo Power (125 W and 250 W for the Core Ultra 9 285K); motherboard defaults sometimes exceed them, so reviews may not match stock behaviour.
- On AMD's AM4/AM5 desktop chips, PPT is about 1.35 × TDP: 65 W → 88 W, 105 W → 142 W, 120 W → 162 W and 170 W → 230 W.
- RAPL energy counters (Intel since Sandy Bridge, AMD on Zen) are readable through Linux powercap in /sys/class/powercap or with 'perf stat -e power/energy-pkg/', so you can report joules per job.
- Thin laptops often sustain around 15-30 W while thick gaming laptops sustain 45 W or more; skin temperature and fan noise limits, not just Tjmax, decide the policy.
- Turbo, DVFS and thermal throttling mechanics are explained in the processors chapter; this section focuses on measuring, sizing and cooling for real machines.
Common mistakes & misconceptions
- Treating TDP as maximum draw — CPUs and GPUs exceed it during boost; size power supplies and coolers on real peaks.
- Panicking at 90-95 °C under load — many modern CPUs are designed to boost until they reach that limit.
- Comparing laptops by processor name alone — sustained power settings matter more.
- Leaving the protective film on a new cooler's base — a classic cause of instant overheating.
Try it: Estimate a GPU server's yearly energy cost and perf per watt in Python
watts, hours, price = 10_000, 24*365, 0.20   # 10 kW server, $/kWh
kwh = watts/1000*hours
print(f'{kwh:,.0f} kWh/year = ${kwh*price:,.0f}')
print('Perf/W:', 5000/watts, 'TFLOPS per W at 5,000 TFLOPS')
Key chips, architectures, standards, tools & concepts
| Name | What it does | Example |
|---|---|---|
| TDP (Thermal Design Power) Chip vendors (definitions differ by vendor) · Metric · Current · Beginner |
Heat in watts that a cooling solution should handle under sustained load; a guideline, not a hard maximum. | A 65 W desktop CPU needs a cooler rated for at least 65 W of sustained heat. |
| Intel Processor Base Power and Maximum Turbo Power Intel (formerly PL1 and PL2) · Metric · Current · Intermediate |
Base Power is the sustained power level; Maximum Turbo Power is the higher limit allowed during boost. | A Core Ultra 9 285K is rated 125 W base power and 250 W maximum turbo power. |
| PL1, PL2 and Tau Intel power management · Concept · Current · Advanced |
Long-duration limit (PL1), short burst limit (PL2) and the time window (Tau) governing how long boost lasts. | Motherboard makers sometimes set PL1 equal to PL2 out of the box, so the CPU boosts indefinitely. |
| AMD PPT, TDC and EDC AMD Ryzen power management · Metric · Current · Advanced |
Package Power Tracking caps total socket power; TDC and EDC cap sustained and peak current. | A Ryzen chip with a 105 W TDP has a PPT of 142 W. |
| Junction temperature (Tjmax) Intel, AMD and NVIDIA datasheets · Metric · Current · Intermediate |
The maximum safe silicon temperature, typically about 95-105 °C for desktop CPUs, at which clocks drop to protect the chip. | A Ryzen 9000 chip sitting at 95 °C under full load is behaving as designed, not failing. |
| Power telemetry (RAPL, turbostat, HWiNFO) Intel and AMD RAPL counters; Linux turbostat; HWiNFO (Windows) · Tool · Current · Intermediate |
On-chip energy counters and tools reporting package power, clocks, temperatures and throttling reasons, so you measure instead of guess. | 'sudo turbostat --interval 5' shows a CPU at 65 W and 4.2 GHz, then clocks falling as it reaches its power limit. |
| CPU frequency governors and power profiles Linux cpufreq (intel_pstate, amd-pstate); Windows power plans · Software · Current · Intermediate |
OS policies such as performance, powersave, schedutil or balanced that choose clock speeds and energy preferences — they visibly change benchmark results. | Switching a laptop to 'performance' with powerprofilesctl raises its compile speed noticeably but shortens battery life. |
| Undervolting and power capping Vendor tools, BIOS, nvidia-smi -pl · Concept · Current · Intermediate |
Lowering voltage or power limits to reduce heat and noise, often with only a small speed loss. | An admin sets GPU power limits 15% lower and loses only about 5% throughput. |
| Thermal interface material Paste, pads, liquid metal · Component · Current · Beginner |
Material filling microscopic gaps between chip and cooler so heat flows efficiently. | Old dried paste on a five-year-old PC is replaced, dropping load temperature by 15 °C. |
| Air cooler, AIO and custom loop Cooling vendors · Component · Current · Beginner |
Heatsink-and-fan coolers, sealed all-in-one liquid coolers, and hand-built water loops with separate pumps and radiators. | A gamer picks a large tower air cooler for a 120 W CPU; an enthusiast uses a 360 mm AIO. |
| GPU power ratings (TGP / TBP) NVIDIA (Total Graphics Power); AMD (Total Board Power) · Metric · Current · Intermediate |
The sustained power a graphics card is designed to draw, used to size power supplies, connectors and case cooling. | An RTX 5090 is rated at 575 W, so builders pair it with a 1,000 W-class ATX 3.1 power supply. |
| Energy to solution (race to idle) HPC and mobile power engineering · Metric · Current · Intermediate |
Total joules to finish a job (power × time); finishing fast and then sleeping can use less energy than running slowly. | A job at 200 W for 60 s uses 12 kJ, beating a 'greener' 120 W setting that takes 120 s and 14.4 kJ. |
| cTDP and laptop power modes Intel configurable TDP; laptop makers' performance modes · Concept · Current · Intermediate |
Laptop makers and users run the same chip at different sustained power levels, so identical processors can perform very differently. | Two laptops with the same CPU differ by 30% in rendering because one sustains 28 W and the other 45 W. |
8.7 Building or Choosing a PC
A PC is a set of parts that must fit together: processor, motherboard, memory, graphics card, storage, power supply, case and cooling. Choosing well means matching parts to what you actually do (gaming, coding, video, AI) and making sure nothing holds the rest back. You also decide between a laptop's portability and a desktop's power, upgradability and cooling.
Think of it like…
Building a PC is like assembling a team: a star striker (GPU) is wasted if the midfield (CPU) and defence (power supply and cooling) cannot keep up.
Real-world example
Zara, a computing student, has a budget of about 1,200 pounds for coding and 1440p gaming. She chooses a mid-range 6- to 8-core CPU on a current socket, a B-series motherboard, 32 GB of DDR5 in two sticks, a 1 TB NVMe SSD, a mid-range current-generation GPU and a quality 750 W ATX 3.1 power supply. Benchmarks show her games are GPU-bound, so the money saved on the CPU went where it mattered. Two sticks of RAM keep dual-channel bandwidth.
How it works
- List your workloads and budget, and decide laptop or desktop.
- Pick the CPU and a compatible motherboard (same socket, suitable chipset).
- Add RAM in matched pairs, NVMe storage and a GPU sized for your games or AI work.
- Size a quality power supply with headroom and the right GPU connectors.
- Choose a case and cooler that fit the parts and keep temperatures sensible.
- After building, update BIOS, enable XMP/EXPO memory profiles and stress-test temperatures.
Who uses it
Students, gamers, creators, IT technicians and anyone advising friends, family or a small office on hardware.
Key takeaway
Check socket, chipset, RAM type, case clearance and power connectors before buying; compatibility mistakes cause most failed builds.
Going deeper
- On AMD's AM5 the CPU provides 24 usable PCIe 5.0-capable lanes (x16 for graphics plus two x4 NVMe links), while the chipset adds more lanes, USB and SATA over a narrower uplink.
- Two DDR5 sticks (one per channel) usually run fastest; four sticks often force lower speeds. DDR5-6000 means 6,000 MT/s, with an actual clock of 3,000 MHz.
- Size a power supply by adding CPU and GPU peak power plus about 100 W for everything else, then 20-30% headroom; ATX 3.x units are designed to ride through short GPU power spikes.
- After building, stress-test: MemTest86+ for memory, Cinebench or Prime95 for the CPU and looped 3DMark for the GPU, while watching temperatures in HWiNFO.
- Prebuilt PCs include a warranty and support but may cut corners on RAM speed, power supply quality or airflow; self-builds give control but you do your own troubleshooting.
- Upgrade paths depend on platform longevity (AMD has supported AM5 across several CPU generations), spare RAM and M.2 slots, and power-supply headroom.
Common mistakes & misconceptions
- Pairing a high-end GPU with a cheap, unrated power supply — buy a quality ATX 3.x unit with native connectors.
- Forgetting to enable XMP or EXPO — memory then runs at slower default speeds.
- Not pushing the 12V-2x6 plug fully home, or bending it sharply — it can overheat.
- Ignoring case clearance — check GPU length and cooler height before buying.
Try it: See what hardware your own computer has
lscpu; free -h; lsblk; lspci | grep -i -E 'vga|nvme'      # Linux
system_profiler SPHardwareDataType                           # macOS
Get-CimInstance Win32_Processor | Select Name,NumberOfCores  # Windows PowerShell
Key chips, architectures, standards, tools & concepts
| Name | What it does | Example |
|---|---|---|
| CPU choice: cores vs single-thread speed Intel, AMD, Apple, Qualcomm · Concept · Current · Beginner |
Games and everyday apps favour fast cores; rendering, compiling and simulation scale with more cores. | A video editor picks a 16-core CPU; a gamer picks an 8-core with large cache. |
| AMD AM5 socket AMD (launched 2022) · Interface · Current · Intermediate |
Desktop socket for Ryzen 7000, 8000 and 9000 CPUs with DDR5 only; AMD's next Zen 6 desktop chips are expected on AM5. | A 2022 AM5 owner drops in a Ryzen 9000 chip after a BIOS update, keeping the motherboard. |
| Intel LGA1851 socket Intel (launched 2024) · Interface · Current · Intermediate |
Socket for Core Ultra 200S (Arrow Lake) desktop CPUs and their 2026 'Plus' refresh, with 800-series chipsets such as Z890. | A builder pairs a Core Ultra 7 CPU with a B860 motherboard and DDR5 memory. |
| Intel LGA1954 socket Intel (announced) · Interface · Emerging · Intermediate |
New socket for Core Ultra 400 'Nova Lake' desktop CPUs, expected from late 2026 into 2027; needs new motherboards. | A builder waiting for Nova Lake knows an LGA1851 board will not accept the new chips. |
| Chipset AMD (e.g. X870E, B850); Intel (e.g. Z890, B860) · Component · Current · Beginner |
Motherboard hub that sets features such as overclocking, extra USB and PCIe lanes, and M.2 slots. | An overclocker buys an Intel Z-series board; a budget build uses a B-series board. |
| DDR5 kit choice JEDEC JESD79-5 · Component · Current · Beginner |
Buy a matched two-stick kit with enough capacity (32 GB suits most students), then enable its XMP or EXPO profile for rated speed. | A 2x16 GB DDR5-6000 kit runs at a slower default until EXPO is enabled in the BIOS. |
| Dual-channel memory Desktop memory controllers · Concept · Current · Beginner |
Using two (or four) sticks so the CPU reads from two memory channels at once, roughly doubling bandwidth. | Replacing one 16 GB stick with two 8 GB sticks noticeably raises integrated-graphics frame rates. |
| Graphics card (GPU) NVIDIA GeForce RTX 50; AMD Radeon RX 9000; Intel Arc B-series · Accelerator · Current · Beginner |
Renders games and runs AI; VRAM size matters for high resolutions and for loading larger AI models. | A student chooses a 16 GB card so local AI models fit entirely in GPU memory. |
| NVMe SSD choice NVM Express; PCIe 4.0 and 5.0 · Component · Current · Beginner |
M.2 NVMe drives load far faster than hard drives; most users need only a PCIe 4.0 drive with DRAM or HMB cache and decent endurance. | Moving a game from a hard drive to a PCIe 4.0 NVMe SSD cuts load times from 60 to 10 seconds. |
| ATX 3.1 power supply Intel ATX power supply design guide · Standard · Current · Intermediate |
PSU specification designed for modern GPUs' brief power spikes, with the 12V-2x6 connector for graphics cards. | A builder picks an 850 W ATX 3.1 unit with a native 12V-2x6 cable for a high-end GPU. |
| 12V-2x6 connector PCI-SIG (PCIe CEM 5.1); successor to 12VHPWR · Interface · Current · Intermediate |
16-pin GPU power connector rated up to 600 W, with shorter sense pins to make poor insertion safer. | The installer pushes the plug fully home and avoids sharp bends near the GPU. |
| 80 PLUS efficiency rating CLEAResult 80 PLUS programme · Standard · Current · Beginner |
Certifies PSU efficiency levels (Bronze, Gold, Platinum, Titanium); higher means less wasted heat. | A Gold PSU wastes noticeably less power as heat than a basic unit at the same load. |
| Bottleneck balance PC building practice · Concept · Current · Beginner |
Making sure no single part, often CPU or GPU, limits the others for your workload and resolution. | At 4K the GPU is the limit, so upgrading the CPU barely changes frame rates. |
| Laptop vs desktop General · Concept · Current · Beginner |
Laptops trade cooling, power and upgradability for portability and battery life; the same chip name can perform differently. | A gaming laptop GPU at 100 W is slower than a desktop card with a similar name at 250 W. |
| Motherboard form factors (ATX, micro-ATX, mini-ITX) Intel ATX specification (1995) and later derivatives · Standard · Current · Beginner |
Standard board sizes and mounting points; smaller boards fit compact cases but offer fewer slots, M.2 sockets and headers. | A mini-ITX build fits under a TV but has only one PCIe slot and two RAM slots. |
8.8 Choosing a Server or Workstation
Servers and workstations are built for reliability and heavy, continuous work rather than looks or gaming. They add features such as error-correcting memory, more processor sockets, remote management and spare power supplies. Choosing one means balancing performance, reliability, space, power and total cost, including whether renting in the cloud is cheaper.
Desktop vs workstation vs rack server
| Desktop PC | Workstation | Rack server | |
|---|---|---|---|
| Memory | Non-ECC, 2 channels | ECC, 4-8 channels | ECC RDIMM, 8-12 channels/socket |
| CPUs | 1 consumer chip | 1 Xeon W or Threadripper PRO | 1-2 Xeon 6 or EPYC |
| Management | None | Sometimes | BMC (iDRAC, iLO, Redfish) |
| Redundancy | Single PSU | Sometimes dual PSU | Hot-swap PSUs, fans, drives |
| Form factor | Tower | Tower or rack | 1U/2U, blade, multi-node |
| Noise | Quiet | Moderate | Loud — machine rooms only |
ECC memory, remote management and redundancy are what you pay extra for.
Think of it like…
A desktop PC is a family car; a server is a delivery lorry built to run all day, every day, with spare tyres and a tracker so the depot can check it remotely.
Real-world example
Orchid Bio, a fictional genomics lab, needed to analyse 40 TB of sequencing data each month. They compared a 2U dual-socket server with 1 TB of ECC RDIMM memory and two GPUs against renting similar cloud instances. The cloud cost about 9,000 dollars a month at their usage, while the server, power and support worked out near 3,500 a month over four years. Because the workload ran around the clock, they bought the server and used cloud only for peaks.
How it works
- Profile the workload: cores, memory size, bandwidth, GPUs, storage and network.
- Choose form factor: tower workstation, or rack server sized in rack units.
- Pick CPUs (single or dual socket), ECC memory, GPUs and storage with growth room.
- Add reliability: redundant power supplies and fans, RAID or replicated storage, and a BMC.
- Compare total cost of ownership with cloud over three to five years, including power and staff.
Who uses it
Sysadmins, HPC and infrastructure engineers, IT managers, researchers and procurement teams.
Key takeaway
Always mention ECC memory, redundancy and out-of-band management (BMC) as the key differences between servers and desktops.
Going deeper
- AMD EPYC 9005 offers up to 192 cores and 12 DDR5 channels per socket; Intel Xeon 6 offers up to 128 performance cores (6900P) or 288 efficient cores (6900E), also with 12 channels on top models.
- Server reliability goes beyond ECC: patrol scrubbing, chipkill-style multi-bit correction, PCIe error containment and predictive-failure alerts recorded in the BMC's event log.
- Enterprises usually refresh servers every three to six years; newer, denser machines can replace several old ones and cut power and licence bills, while refurbished servers suit labs and homelabs.
- Workstation platforms (Threadripper PRO, Xeon W) provide many cores, eight memory channels and plenty of PCIe lanes for multi-GPU rigs, plus ISV-certified drivers for CAD and simulation.
- 8-GPU HGX servers for AI training can draw over 10 kW each, needing high-power racks, often liquid cooling and several 400 Gb/s network links per node.
- Security baseline: Secure Boot, TPM 2.0, signed firmware, a silicon root of trust in the BMC, and an isolated management network that never faces the Internet.
Common mistakes & misconceptions
- Exposing BMC web interfaces to the Internet — keep them on a separate management network and patch their firmware.
- Leaving memory channels empty to save money — bandwidth drops sharply for memory-bound workloads.
- Ignoring software licensing when choosing core counts — licences can cost more than the hardware.
- Running critical systems without a support contract — waiting days for parts means days of downtime.
Try it: Query a server's BMC and hardware from the OS (on your own server)
sudo ipmitool sensor list | head      # temperatures, fans, voltages via BMC
sudo ipmitool sel list | tail         # hardware event log
sudo dmidecode -t memory | grep -E 'Type:|Speed|Error'
Key chips, architectures, standards, tools & concepts
| Name | What it does | Example |
|---|---|---|
| Server form factors (tower, 1U/2U, blade, multi-node) Dell, HPE, Lenovo, Supermicro and OCP designs · Concept · Current · Beginner |
Towers suit small offices; 1U and 2U rack servers fill data centres; blades and multi-node chassis share power and cooling for density. | A school uses a quiet tower server, while a hosting firm packs four compute nodes into each 2U chassis. |
| Dual-socket server Intel Xeon; AMD EPYC platforms · System · Current · Intermediate |
A motherboard with two CPU sockets, doubling cores and memory channels in one box. | A database server uses two 64-core EPYC CPUs for 128 cores and 24 memory channels. |
| Memory population: one ECC RDIMM per channel Server platform memory guidelines (Intel, AMD, OEMs) · Concept · Current · Intermediate |
Fill every memory channel with identical ECC RDIMMs, ideally one per channel, to get full bandwidth and the highest supported speed. | A 12-channel EPYC socket gets twelve 64 GB RDIMMs (768 GB) rather than eight larger modules leaving four channels empty. |
| Per-core software licensing Microsoft Windows Server; VMware by Broadcom; Oracle; many databases · Concept · Current · Intermediate |
Many server products are priced per physical core, so a high-core-count CPU can multiply licence costs well beyond the hardware price. | Licensing Windows Server Datacenter for two 64-core CPUs can cost more than the server hardware itself. |
| Storage and RAID layout Hardware RAID controllers, HBAs, software RAID and ZFS · Concept · Current · Intermediate |
Servers typically mirror two small boot drives and keep data on NVMe or SAS drives protected by RAID, ZFS or replication. | Orchid Bio mirrors two 480 GB boot SSDs and stores sequencing data on eight NVMe drives in a RAIDZ2 pool. |
| Server networking (25-400 GbE) NVIDIA ConnectX, Broadcom and Intel network adapters · Component · Current · Intermediate |
Servers use 25 or 100 GbE for general work, and 200-800 Gb/s Ethernet or InfiniBand for storage-heavy and GPU clusters. | A virtualisation host bonds two 25 GbE ports for redundancy and keeps a separate 1 GbE port for its management controller. |
| Vendor BMCs: iDRAC, iLO and XClarity Controller Dell, HPE and Lenovo · Software · Current · Intermediate |
Dell, HPE and Lenovo's out-of-band management controllers: remote console, power control, firmware updates and alerts, scriptable through Redfish. | A technician mounts an OS installer image through iLO without visiting the data centre. |
| Redundant PSUs and fans Server vendors · Component · Current · Beginner |
Two or more hot-swappable power supplies and fans, so one can fail without stopping the server. | A failed PSU is swapped mid-afternoon while the server keeps running on the other one. |
| Choosing server CPUs Intel; AMD · Processor · Current · Intermediate |
Pick Xeon 6 or EPYC 9005 models by cores needed, per-core speed, memory channels, PCIe lanes — and how your software is licensed. | A per-core-licensed database runs on a 16-core high-frequency EPYC, while a VM host takes a 128-core part. |
| Workstation Dell, HP, Lenovo, custom builders · System · Current · Beginner |
Powerful desktop for professionals with ECC memory, certified drivers, and multiple GPUs. | An architect runs large CAD models on a workstation with 256 GB ECC RAM and a pro GPU. |
| GPU server NVIDIA HGX/DGX; OEMs such as Supermicro, Dell, HPE · System · Current · Intermediate |
Server holding four to eight high-end accelerators linked by fast interconnects, for AI and HPC. | A university buys one 8-GPU server so several research groups can share time for model training. |
| TCO (total cost of ownership) Business practice · Metric · Current · Intermediate |
Full lifetime cost: purchase, power, cooling, space, support, staff and disposal, not just the price tag. | A cheaper server costs more over five years because it uses 30% more electricity. |
| Cloud vs on-premises AWS, Azure, Google Cloud vs own hardware · Concept · Current · Beginner |
Cloud suits spiky or short work; owning hardware is often cheaper for steady, round-the-clock use. | A start-up rents GPUs for a two-week experiment instead of buying servers. |
| Support contract and warranty Server vendors · Service · Current · Beginner |
Agreements guaranteeing replacement parts or engineer visits within set times, such as next business day. | A hospital chooses four-hour onsite support for servers running patient systems. |
8.9 Careers in Computing Systems
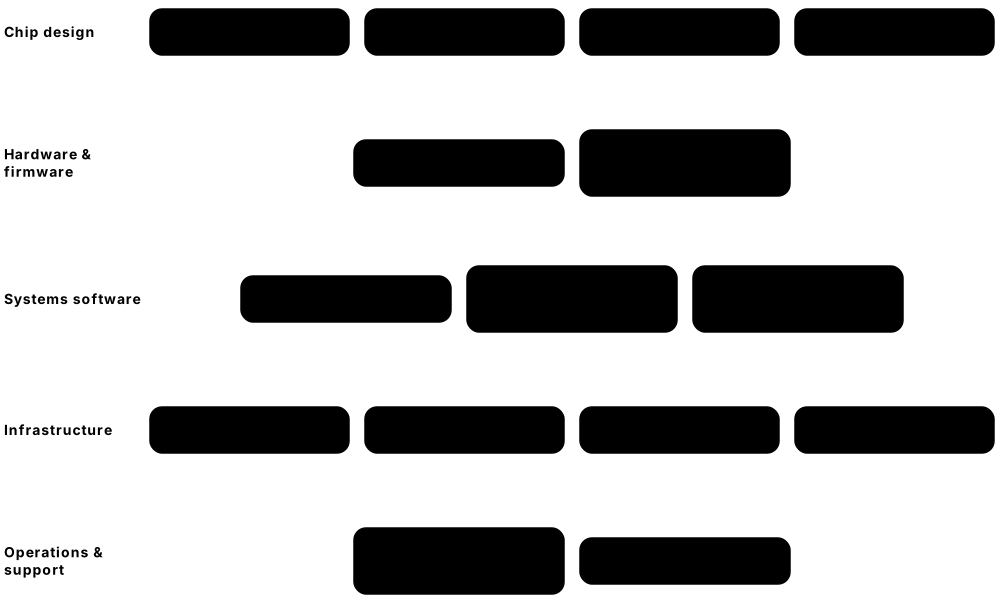
Knowing how computers really work opens many careers, from designing chips to keeping huge cloud and AI systems running. Some jobs are close to the hardware (chip design, firmware, data-centre work), while others are about software that squeezes the best out of hardware (kernels, GPU programming, performance and reliability). Most share the same core skills: computer architecture, operating systems, Linux, programming and careful measurement.
Think of it like…
The computing industry is like a city: some people design the buildings (architects), some build and wire them (hardware and firmware engineers), and some keep the lights on and traffic flowing (sysadmins, SREs and data-centre technicians).
Real-world example
Jamal studied computer science and enjoyed his architecture module most. In his final year he built a RISC-V core on a cheap FPGA and profiled CUDA code on a free cloud notebook, putting both on GitHub. He landed a graduate role as a performance engineer at a fictional cloud firm, Stratacloud, tuning servers. Two years later he moved into ML infrastructure, managing GPU clusters for model training.
How it works
- Learn the core: programming (C/C++ and Python), computer architecture, operating systems and Linux.
- Pick a direction: hardware design, low-level software, HPC/AI infrastructure or operations.
- Build visible projects and contribute to open source in that direction.
- Add a relevant certification or course if targeting IT and cloud roles.
- Apply for internships and graduate roles, and practise explaining your projects clearly.
Who uses it
Students choosing a specialism, career changers and early-career engineers planning their next move.
Key takeaway
Employers value a working project you can explain in depth more than a long list of buzzwords on a CV.
Going deeper
- Chip-design roles usually expect an electrical or computer engineering degree, often a master's; software-side roles (kernel, performance, cloud) welcome computer science graduates and strong self-taught portfolios.
- IT support and data-centre technician jobs are common entry routes; many cloud engineers and SREs started there and moved up after a few years of hands-on experience.
- Demand in 2025-26 is driven by AI data-centre build-outs (GPU cluster engineers, technicians, power and cooling specialists), custom silicon at hyperscalers and the growing RISC-V ecosystem.
- Interviews across these roles probe architecture (caches, pipelines), operating systems (processes, virtual memory), C/C++ or Python, Linux skills and a debugging story from your own project.
- Strong portfolio signals include measured GitHub projects, open-source contributions (Linux kernel, LLVM, OpenBMC, Zephyr), Student Cluster Competition entries and clear technical write-ups.
- Titles vary: 'performance engineer' may mean load testing at one company and CPU microarchitecture analysis at another — read the responsibilities, not just the title.
Common mistakes & misconceptions
- Collecting certificates without projects — employers want evidence you can build and debug real systems.
- Assuming hardware careers need a PhD — many RTL, verification and firmware roles hire bachelor's graduates.
- Neglecting communication — explaining trade-offs clearly is assessed in nearly every interview.
Key chips, architectures, standards, tools & concepts
| Name | What it does | Example |
|---|---|---|
| Computer architect CPU, GPU and accelerator companies; research labs · Career · Current · Advanced |
Designs processor microarchitectures and decides trade-offs using simulators and workload analysis. | Skills: C++, gem5-style simulation, caches and pipelines, statistics; often needs a master's or PhD. |
| RTL design engineer Chip companies and start-ups · Career · Current · Advanced |
Writes hardware descriptions in Verilog/SystemVerilog or VHDL that become real chip logic. | Skills: digital logic, SystemVerilog, timing, synthesis tools; designs a cache controller block. |
| Design verification engineer Chip companies · Career · Current · Advanced |
Proves a chip design works before manufacture using testbenches, UVM and formal methods. | Skills: SystemVerilog, UVM, Python scripting; writes tests that find a bug before a costly tape-out. |
| Firmware engineer (UEFI, BMC and device firmware) Server, PC, storage, GPU and consumer-electronics makers · Career · Current · Intermediate |
Writes low-level boot, management and controller firmware — UEFI, BMC, SSD or GPU firmware — that runs before or beneath the operating system. | Skills: C, Rust, datasheets, JTAG debugging; adds a Redfish feature to a server's OpenBMC firmware. |
| Systems and kernel engineer OS vendors, cloud providers, device makers · Career · Current · Advanced |
Develops operating-system kernels, drivers, file systems and hypervisors. | Skills: C, Linux internals, concurrency, git; fixes a scheduler bug in a Linux driver. |
| GPU / CUDA developer AI, games, simulation and finance companies · Career · Current · Advanced |
Writes and tunes code that runs on GPUs, from custom kernels to optimised libraries. | Skills: C++, CUDA or HIP, profiling with Nsight; speeds up an attention kernel threefold. |
| ML infrastructure engineer AI labs and cloud providers · Career · Current · Advanced |
Builds and runs the GPU clusters, schedulers and pipelines that train and serve AI models. | Skills: Python, Kubernetes or Slurm, networking, PyTorch internals; keeps a 1,000-GPU training job running. |
| HPC engineer / sysadmin Universities, national labs, weather and energy firms · Career · Current · Intermediate |
Installs, tunes and supports supercomputers and clusters, schedulers and scientific software. | Skills: Linux, Slurm, MPI, Spack, shell scripting; helps researchers scale a code to 500 nodes. |
| Performance engineer Software, cloud, games and hardware companies · Career · Current · Intermediate |
Measures, profiles and optimises systems, and builds benchmarks to catch slowdowns. | Skills: perf, flame graphs, statistics, C/C++ or Java; finds a regression that slowed checkout 20%. |
| Cloud engineer Cloud users and providers · Career · Current · Intermediate |
Designs and automates infrastructure on AWS, Azure or Google Cloud using infrastructure as code. | Skills: Linux, networking, Terraform, Python; moves a company's web app to autoscaling cloud servers. |
| Site reliability engineer (SRE) Concept from Google; widely adopted · Career · Current · Intermediate |
Keeps services reliable with monitoring, automation, incident response and error budgets. | Skills: Linux, Kubernetes, Prometheus, coding; automates recovery so an outage lasts minutes, not hours. |
| Data-centre technician Cloud, colocation and enterprise data centres · Career · Current · Beginner |
Installs, cables, repairs and replaces servers, drives and network gear on site. | Skills: hardware basics, cabling, safety, ticket systems; swaps a failed GPU tray within the repair window. |
| IT support / desktop technician Every organisation · Career · Current · Beginner |
Builds, repairs and supports PCs, laptops and user accounts; a common entry point into IT. | Skills: CompTIA A+ level knowledge, Windows, customer service; re-images 30 student laptops before term. |
| Physical design engineer Chip companies and design-services firms · Career · Current · Advanced |
Turns synthesised logic into a manufacturable layout: floorplanning, placement, clock trees, routing and timing closure. | Skills: Cadence or Synopsys tools, static timing analysis, Tcl scripting; closes timing on a 3 GHz CPU block. |
| Field application engineer (FAE) Chip and hardware vendors · Career · Current · Intermediate |
Technical expert who helps customers design products around a vendor's chips, combining engineering depth with customer-facing work. | Skills: embedded systems, debugging, clear communication; helps a customer bring up Linux on a new SoC board. |
8.10 Certifications & Courses
Certifications are exams that prove you know a defined set of skills, and many employers use them to filter CVs, especially for IT, Linux and cloud roles. University courses, many free online, teach the deeper theory of how computers work. A sensible plan mixes one or two certifications with solid courses and hands-on projects.
Think of it like…
A certification is like a driving licence that proves you passed a standard test, while courses and projects are the hours of real driving that make you good.
Real-world example
Hannah worked in retail and wanted an IT career. She passed CompTIA A+ in four months, then took Linux+ while building a home lab. Her first job was desktop support at a fictional council, Westbrook District. A year later she earned AWS Certified Cloud Practitioner and then Solutions Architect - Associate, moving into a junior cloud engineer role.
How it works
- Choose a target role, then list the certifications that job adverts for it mention.
- Start with a foundation (A+, a cloud fundamentals exam or an NVIDIA associate exam).
- Study with official objectives, a course and plenty of hands-on labs.
- Book the exam once practice tests are consistently comfortable, and note renewal rules.
- Back the certificate with a portfolio project that uses the same skills.
Who uses it
Students, career changers, IT staff seeking promotion and employers checking baseline skills.
Key takeaway
Exam codes change every few years, so always check the vendor's site for the current version before buying study materials.
Going deeper
- Formats differ: CompTIA and most cloud exams use multiple choice plus some performance-based tasks, while Red Hat and Linux Foundation exams are entirely hands-on in live systems — harder but highly respected.
- Renewal rules: CompTIA certifications last three years (renewable through continuing education), AWS certifications three years, and Microsoft role-based certifications need a free online renewal assessment every year.
- Exam fees range from roughly US$100 for fundamentals exams to about US$500 for hands-on professional exams; student discounts, training-programme vouchers and employer funding are common.
- University courses such as MIT 6.1910, CMU 15-213 and Berkeley CS61C give no certificate but build the architecture and systems depth that hardware and performance interviews test.
- Linux and Kubernetes certifications (RHCSA, LFCS, Linux+, CKA, CKAD) are described in the operating-systems chapter; they pair naturally with the cloud certifications listed here.
- NVIDIA's programme spans associate exams (AI infrastructure and operations, generative AI) and professional ones (AI infrastructure, AI networking), useful for GPU-cluster jobs.
Common mistakes & misconceptions
- Using exam 'dumps' — they break exam agreements, can get certifications revoked and leave you unable to do the job.
- Buying study material for a retired exam version — check the current exam code on the vendor's site first.
- Stacking many fundamentals badges — one foundation, one hands-on associate certification and real projects impress more.
Key chips, architectures, standards, tools & concepts
| Name | What it does | Example |
|---|---|---|
| CompTIA A+ (220-1201 and 220-1202) CompTIA, V15 launched March 2025 · Certification · Current · Beginner |
Entry-level IT certification in two exams covering hardware, mobile devices, operating systems, troubleshooting and security basics. | A school leaver passes both A+ exams and gets a first help-desk job. |
| CompTIA Network+ (N10-009) CompTIA (V9, 2024) · Certification · Current · Beginner |
Vendor-neutral networking basics — IP addressing, switching, routing, Wi-Fi and troubleshooting — expected for data-centre and support roles. | A data-centre technician adds Network+ to A+ before applying for a network operations role. |
| CompTIA Server+ and Cloud+ CompTIA (Server+ SK0-005; Cloud+ CV0-004) · Certification · Current · Intermediate |
Vendor-neutral exams on server hardware, storage and virtualisation (Server+) and cloud operations (Cloud+). | A data-centre technician takes Server+ to show knowledge of RAID, BMCs and server installation. |
| AWS Certified Cloud Practitioner and Solutions Architect - Associate Amazon Web Services · Certification · Current · Beginner |
Foundational AWS cloud exam (CLF-C02), then the popular associate-level exam on designing AWS architectures. | A graduate earns Solutions Architect - Associate and designs a three-tier web app in AWS. |
| Microsoft Azure AZ-900 and AZ-104 Microsoft · Certification · Current · Beginner |
Azure Fundamentals (AZ-900) introduces cloud concepts; Azure Administrator (AZ-104) proves hands-on Azure management skills. | An IT administrator passes AZ-104 before moving the office's servers to Azure. |
| Google Cloud Associate Cloud Engineer Google Cloud · Certification · Current · Intermediate |
Associate exam on deploying, monitoring and managing projects and resources on Google Cloud. | A developer passes ACE and automates deployments with the gcloud command line. |
| FinOps Certified Practitioner FinOps Foundation (Linux Foundation) · Certification · Current · Intermediate |
Entry-level certification in cloud financial management: the FinOps Framework, cost allocation, commitments and unit economics. | A cloud engineer earns it so she can lead her team's monthly cost reviews. |
| Data-centre credentials (EPI CDCP, BICSI DCDC) EPI; BICSI · Certification · Current · Intermediate |
Industry courses and certifications on data-centre design, power, cooling and operations for facility and infrastructure roles. | A technician completes CDCP to understand redundancy levels, cooling and power distribution before applying for a supervisor post. |
| NVIDIA certifications (NCA-AIIO, NCP-AII and others) NVIDIA · Certification · Current · Intermediate |
Associate and professional exams in AI infrastructure, operations, networking and generative AI. | A data-centre engineer takes the AI Infrastructure and Operations associate exam before joining a GPU cluster team. |
| NVIDIA Deep Learning Institute (DLI) NVIDIA · Resource · Current · Beginner |
Hands-on courses in CUDA, accelerated computing, data science and AI, some free, with cloud GPU labs. | A student completes a DLI CUDA course and writes her first GPU kernel in a browser lab. |
| MIT 6.004 / 6.1910 Computation Structures MIT (materials on MIT OpenCourseWare) · Resource · Current · Intermediate |
MIT's course on digital logic, processor design and memory systems; renamed 6.1910 in MIT's new numbering. | A self-learner follows the OpenCourseWare lectures and builds a simple processor in the labs. |
| CMU 15-213 Introduction to Computer Systems Carnegie Mellon University · Resource · Current · Intermediate |
Famous systems course based on CS:APP, with labs such as the bomb lab and malloc lab. | Students defuse the 'binary bomb' by reading x86-64 assembly in a debugger. |
| Berkeley CS61C Great Ideas in Computer Architecture UC Berkeley · Resource · Current · Intermediate |
Course on machine structures: C, RISC-V assembly, caches, parallelism and digital logic, with public materials. | A learner builds a RISC-V CPU in Logisim through the course's project. |
| Coursera and edX computing courses Coursera; edX · Resource · Current · Beginner |
Online platforms hosting university courses such as nand2tetris and computer architecture, often free to audit. | A career changer audits Nand to Tetris on Coursera and builds a computer from NAND gates. |
8.11 Books & Learning Resources
A handful of classic books and websites explain computers from the transistor up, and most professionals have read at least one of them. Some are gentle introductions, others are university textbooks, and some are practical references used daily at work. Pick one at your level, work through it with exercises, and use online resources to see real hardware details.
Think of it like…
These resources are like a ladder: friendly popular-science books are the first rungs, textbooks the middle, and vendor manuals and expert blogs the top.
Real-world example
Nadia set herself a one-year plan. She read Petzold's 'Code' for the big picture, worked through nand2tetris to build a computer in software, then studied CS:APP chapters on memory and linking alongside OSTEP for operating systems. In her final term she read parts of Hennessy and Patterson's quantitative book and followed Chips and Cheese articles to see real CPUs analysed. She now explains caches confidently in interviews.
How it works
- Start with a gentle overview (Code, or Ben Eater's videos).
- Build something from the ground up (nand2tetris).
- Study a core textbook with exercises (Patterson and Hennessy, CS:APP, OSTEP).
- Go deeper with advanced books on architecture, GPUs or performance.
- Keep up with expert blogs, vendor manuals and Compiler Explorer experiments.
Who uses it
Students, self-taught programmers, interview candidates and working engineers refreshing fundamentals.
Key takeaway
Check the edition: newer editions add RISC-V, AI accelerators and modern GPUs, which interviewers increasingly ask about.
Going deeper
- Free and legal: OSTEP, Agner Fog's manuals, nand2tetris course materials, MIT OpenCourseWare and the Intel, AMD, Arm and RISC-V architecture manuals cost nothing.
- Pick the right edition: Computer Organization and Design exists in MIPS, Arm and RISC-V editions — choose RISC-V for current courses; CS:APP's 3rd edition (x86-64) remains the standard.
- Read actively: do the exercises, reproduce experiments such as cache-stride and branch-prediction tests on your own machine, and write notes or a blog — that is what makes knowledge stick for interviews.
- Stay current with expert sources: Chips and Cheese, Brendan Gregg's blog, LWN.net for Linux kernel news, and talks from Hot Chips, ISCA, SC and USENIX conferences.
- Primary references behind most blog posts are the Intel 64 and IA-32 Software Developer's Manuals, the Arm Architecture Reference Manual, the RISC-V ISA specifications and NVIDIA's CUDA C++ Programming Guide.
Common mistakes & misconceptions
- Starting with the hardest textbook — CA:AQA without COD basics overwhelms most beginners.
- Reading without doing — skipping exercises and labs leaves knowledge shallow.
- Relying on outdated or pirated PDFs — use current editions and legitimate free resources.
Key chips, architectures, standards, tools & concepts
| Name | What it does | Example |
|---|---|---|
| Computer Organization and Design: RISC-V Edition David Patterson and John Hennessy (2nd ed. 2021) · Resource · Current · Intermediate |
The standard beginner-to-intermediate textbook on how hardware and software meet, using the RISC-V instruction set. | Students learn datapaths, pipelining and caches from it in a second-year architecture module. |
| Computer Architecture: A Quantitative Approach Hennessy, Patterson and Kozyrakis (7th ed. 2025) · Resource · Current · Advanced |
The graduate-level step after Patterson and Hennessy's COD; study its memory-hierarchy, parallelism, warehouse-scale and domain-specific-architecture chapters. | A master's student reads its accelerator chapter before an interview with an AI-chip start-up. |
| Computer Systems: A Programmer's Perspective (CS:APP) Randal Bryant and David O'Hallaron (3rd ed. 2015) · Resource · Current · Intermediate |
Explains computers from a programmer's view: data representation, x86-64 assembly, caches, linking, processes and virtual memory. | A developer finally understands why a loop order change made code faster after reading the cache chapter. |
| The Elements of Computing Systems (nand2tetris) Noam Nisan and Shimon Schocken (2nd ed. 2021) · Resource · Current · Beginner |
Project-based book and course: build a computer from NAND gates up to an assembler, compiler and OS. | Learners build every layer of the 'Hack' computer in free simulators over twelve projects. |
| Code: The Hidden Language of Computer Hardware and Software Charles Petzold (2nd ed. 2022) · Resource · Current · Beginner |
Friendly popular book building up from Morse code and relays to a working computer. | A sixth-former reads it before university and arrives understanding binary adders. |
| Operating Systems: Three Easy Pieces (OSTEP) Remzi and Andrea Arpaci-Dusseau (free online) · Resource · Current · Intermediate |
Free, readable OS textbook organised around virtualisation, concurrency and persistence. | Students read the chapters on paging and locks before an OS exam. |
| Tanenbaum's textbooks Andrew S. Tanenbaum and co-authors · Resource · Current · Intermediate |
Classic textbooks: Structured Computer Organization and Modern Operating Systems. | A university course uses Modern Operating Systems for scheduling and memory management. |
| Programming Massively Parallel Processors Hwu, Kirk and El Hajj (5th ed. 2026) · Resource · Current · Advanced |
The leading GPU and CUDA programming textbook; the 5th edition adds LLM-related and multi-GPU topics. | A student works through its tiled matrix multiplication chapter to write a fast CUDA kernel. |
| Systems Performance (2nd ed.) Brendan Gregg (2020) · Resource · Current · Advanced |
In-depth guide to performance methods and Linux tools, including perf, flame graphs and BPF. | An SRE keeps it on her desk and applies its USE-method checklists during incidents. |
| Agner Fog's optimisation manuals Agner Fog (free online) · Resource · Current · Advanced |
Free guides to C++ and assembly optimisation, CPU microarchitectures and instruction latency tables. | A developer checks instruction latency tables to choose between two ways of dividing numbers. |
| Ben Eater's 8-bit breadboard computer Ben Eater (videos and kits) · Resource · Current · Beginner |
Video series and kits that build a working 8-bit computer and a 6502 computer on breadboards. | A student builds the clock, registers and ALU over a summer and finally 'sees' a CPU work. |
| Chips and Cheese Independent technical publication · Resource · Current · Advanced |
In-depth articles measuring and explaining real CPU and GPU microarchitectures with microbenchmarks. | An interview candidate reads its analysis of a new core's cache latencies before a hardware interview. |
| WikiChip WikiChip (community wiki) · Resource · Current · Intermediate |
Wiki of processor families, microarchitectures, process nodes and die details. | A student checks WikiChip to compare cache sizes across several CPU generations. |
| Vendor optimisation guides and ISA manuals Intel, AMD, Arm, NVIDIA, RISC-V International · Resource · Current · Advanced |
Official manuals describing instructions, performance counters and tuning advice for each architecture. | A compiler engineer reads the vendor optimisation guide to learn the new core's preferred instruction sequences. |
| Understanding Software Dynamics Richard L. Sites (2021) · Resource · Current · Advanced |
Practical book on measuring and explaining the performance of real software, especially rare slow requests and interference between programs. | A performance engineer uses its tracing approach to explain why one request in a thousand takes 100 times longer. |
8.12 Hands-On Projects & Lab Ideas
The fastest way to really understand computers is to build and measure things yourself. Many great projects are free or cheap: simulate a CPU, program a small FPGA, cluster a few single-board computers or run GPU code in a free online notebook. Finished projects also make an excellent portfolio for interviews.
Think of it like…
Reading about computers without building anything is like learning to swim from a book; projects are getting into the pool.
Real-world example
Ethan, a first-year student, spent one term on three projects. He built an 8-bit CPU in the free Digital simulator, benchmarked his laptop's memory bandwidth with a short NumPy script (about 18 GB/s on a single thread), and ran a CUDA matrix multiply on a free cloud GPU notebook that was 40 times faster than his plain Python loop. He wrote up each one on GitHub with graphs, and an interviewer spent most of his interview asking about them.
How it works
- Pick a project that matches the career direction you are curious about.
- Start small and get a minimal version working end to end.
- Measure results (speed, resource use) and record them in a table or graph.
- Write a short README explaining what you built, what you measured and what you learned.
- Publish it (for example on GitHub) and be ready to discuss it in interviews.
Who uses it
Students, self-learners and job-seekers building a portfolio for hardware, systems, HPC or cloud roles.
Key takeaway
Always include numbers and graphs in your write-up; 'it got 3.2x faster because of X' is far more impressive than 'I optimised it'.
Going deeper
- A strong write-up states the question, method, hardware and software versions, results with graphs and error bars, and an explanation linking the results to theory such as caches or Amdahl's law.
- Cheap hardware goes far: iCE40 FPGA boards cost tens of dollars with fully open toolchains (Yosys, nextpnr), Pico boards cost a few dollars, and used office mini-PCs make excellent homelab nodes.
- Free compute: Google Colab and Kaggle notebooks give limited free GPU time, while cloud free tiers and student credits cover small experiments — set budget alerts first.
- Simulators avoid buying hardware: Verilator for Verilog, QEMU for whole systems including RISC-V, gem5 for architecture research and Wokwi for online microcontroller projects.
- When contributing upstream, start with small fixes, follow the project's contribution guide, include benchmark evidence with performance patches and expect several review rounds.
Common mistakes & misconceptions
- Starting too big, such as an out-of-order CPU first — finish a small working version, then extend it.
- Publishing results without method or raw data — readers and interviewers cannot trust them.
- Leaving cloud resources running after an experiment — set budget alerts and delete everything afterwards.
Try it: A STREAM-like memory bandwidth test with NumPy
import numpy as np, time
n = 50_000_000                      # ~400 MB per array
a = np.ones(n); b = np.ones(n); c = np.empty(n)
for _ in range(3):
    t = time.perf_counter(); np.add(a, b, out=c); dt = time.perf_counter() - t
    print(f'Add bandwidth: {3*8*n/dt/1e9:.1f} GB/s')   # 2 reads + 1 write
Key chips, architectures, standards, tools & concepts
| Name | What it does | Example |
|---|---|---|
| Build a CPU in a logic simulator Logisim-evolution; Digital (Helmut Neemann) · Concept · Current · Beginner |
Design an ALU, registers and a simple CPU graphically in a free simulator, then run your own machine-code programs on it. | A student's 8-bit CPU in Digital runs a program that counts to 255, then is exported to Verilog for an FPGA. |
| Verilog on a low-cost FPGA board Lattice iCE40/ECP5 boards; Yosys and nextpnr open toolchain · Technology · Current · Intermediate |
Writing hardware in Verilog and loading it onto an inexpensive FPGA to see real circuits run. | A student blinks LEDs, then builds a UART and finally a small RISC-V core on an iCE40 board. |
| RISC-V core project RISC-V International (open ISA) · Architecture · Current · Advanced |
Designing a small processor that runs the open RISC-V base instruction set (RV32I), in a simulator or FPGA. | A team's RV32I core runs a C program printing 'Hello' on their FPGA board. |
| Raspberry Pi cluster Raspberry Pi Ltd; MPI or Kubernetes software · System · Current · Intermediate |
Several single-board computers networked together to practise parallel computing or Kubernetes cheaply. | Four Raspberry Pi boards run an MPI program that estimates pi, showing speed-up with more nodes. |
| Benchmark your own laptop Tools: sysbench, fio, Geekbench, Cinebench · Concept · Current · Beginner |
Measuring your own machine's CPU, memory, disk and thermals, on battery and on mains, with repeated runs. | A student finds her laptop loses 25% performance on battery and writes up why. |
| CUDA on a free cloud notebook Google Colab, Kaggle notebooks · Concept · Current · Beginner |
Using free hosted GPUs to run CuPy, PyTorch or simple CUDA kernels without owning a GPU. | A learner compares NumPy and CuPy matrix multiplication on a free notebook GPU. |
| Homelab with Proxmox VE Proxmox Server Solutions (open source) · Software · Current · Intermediate |
Free hypervisor platform for running virtual machines and containers on an old PC or mini PC. | A student runs a Linux VM, a Windows VM and a Kubernetes cluster on a second-hand desktop. |
| Write a tiny emulator Common teaching project (e.g. CHIP-8) · Concept · Current · Intermediate |
Programming a simulator for a simple real or invented CPU, to understand fetch, decode and execute. | A student's CHIP-8 emulator runs classic Pong after implementing all 35 instructions. |
| Cache-effects experiment Teaching experiment based on CS:APP ideas · Concept · Current · Intermediate |
Timing array access with growing sizes and strides to reveal L1, L2, L3 and memory latencies. | Ethan's graph shows clear steps where his array outgrows each cache level. |
| Parallel speed-up study OpenMP, Python multiprocessing · Concept · Current · Intermediate |
Running the same job on 1, 2, 4 and 8 cores and plotting speed-up against Amdahl's prediction. | A student's speed-up flattens at 5.5x on 8 cores, matching a 5% serial part. |
| Profile and optimise an open-source program Linux perf, flame graphs, GitHub · Concept · Current · Advanced |
Finding a hot spot in a real project, improving it and offering the change upstream. | A student speeds up an image library's resize routine by 15% and gets the pull request merged. |
| Embedded sensor node ESP32 or Raspberry Pi Pico 2 W; MQTT · Concept · Current · Beginner |
Build a battery-powered sensor that sleeps, wakes, measures and reports over Wi-Fi, then measure its current draw and predict battery life. | A student's ESP32-C6 node averages 0.5 mA, predicting about seven months on a 2,500 mAh battery. |
| Hack on a teaching OS kernel (xv6) MIT xv6 (used in MIT 6.1810) · Concept · Current · Advanced |
Add a system call, scheduler change or memory feature to xv6, a small Unix-like teaching kernel for RISC-V that runs in QEMU. | A student adds a 'trace' system call to xv6 that prints every system call a chosen program makes. |
| x86 vs Arm cloud comparison AWS, Azure or Google Cloud free credits · Concept · Current · Intermediate |
Run the same benchmark on comparable x86 and Arm cloud instances, then compare performance, cost per job and providers' efficiency claims. | A student shows her web service handles 18% more requests per dollar on Graviton than on a similar x86 instance. |
8.13 Interview Questions & Model Answers
Technical interviews for systems, hardware, HPC and cloud jobs repeat a core set of questions about how computers work. Short, clear answers with an example show real understanding. Each item below is a common question, a short model answer and a hint on how to say it well.
Think of it like…
Preparing these is like learning the key moves before a match: you will not know every play, but the basics come up every time.
Real-world example
In her interview at a fictional chip start-up, Ola was asked what happens on a cache miss. She explained the lookup, the request to the next level, the line fill and the restart, then added that out-of-order cores keep working on other instructions meanwhile. She finished with a real example from her cache-stride experiment. The interviewer moved straight on to harder questions, a good sign.
How it works
- Listen for what the question is really testing (concept, trade-off or debugging approach).
- Give a one-sentence definition first.
- Explain how it works in two or three steps.
- Add a trade-off, number or real example from your own projects.
- If unsure, reason aloud from first principles rather than guessing silently.
Who uses it
Anyone interviewing for software, systems, hardware, HPC, cloud or ML infrastructure roles.
Key takeaway
Practise answering aloud in under one minute, then be ready for the follow-up 'why?' or 'what would you measure?'.
Going deeper
- Use STAR (Situation, Task, Action, Result) for behavioural and project questions, and keep technical answers to about a minute before inviting follow-ups.
- Numbers worth knowing: L1 hit about 1 ns, DRAM about 100 ns, NVMe read tens of microseconds, same-data-centre round trip about 0.5 ms, intercontinental 100 ms or more; cache line 64 bytes; page 4 KiB.
- Debugging questions reward method: state a hypothesis, the tool you would use (top, vmstat, iostat, perf, strace), the evidence you expect and how you would confirm the fix.
- Hardware interviews often include whiteboard design — a FIFO, a cache lookup, a pipeline hazard diagram or a finite-state machine in Verilog — so practise drawing them.
- Prepare questions for the interviewer about the team's hardware, tools, on-call duties and how performance or reliability is measured; it signals genuine interest.
Common mistakes & misconceptions
- Bluffing when unsure — say what you know and reason aloud; honest reasoning scores better.
- Reciting definitions without examples — tie answers to numbers or your own projects.
- Jumping straight to a fix in debugging questions — gather data and narrow the cause first.
Key chips, architectures, standards, tools & concepts
| Name | What it does | Example |
|---|---|---|
| What happens when a cache miss occurs? Computer architecture · Concept · Current · Intermediate |
The CPU fetches the missing line from the next cache level or memory, stores it, possibly evicting another, then completes the access. | Mention the 64-byte line, latency rising from about a nanosecond to around 100 ns, and that out-of-order cores keep working meanwhile. |
| Process vs thread? Operating systems · Concept · Current · Beginner |
A process has its own address space; threads within a process share memory but have separate stacks and registers. | Say: processes isolate, threads share. Browsers use separate processes per site for safety and threads inside each for speed. |
| Explain virtual memory. Operating systems · Concept · Current · Intermediate |
Each process sees its own private address space; page tables and the TLB map virtual pages to physical memory or disk. | Add that it gives isolation and lets programs use more memory than RAM, at the cost of page faults. |
| Why are GPUs fast for AI? GPU architecture · Concept · Current · Beginner |
AI is mostly huge matrix multiplications; GPUs run thousands of parallel lanes with tensor cores and very high-bandwidth memory. | Contrast with CPUs: few powerful cores for branchy code versus many simple lanes for identical maths on lots of data. |
| Latency vs bandwidth? Performance fundamentals · Concept · Current · Beginner |
Latency is how long one item takes to arrive; bandwidth is how much data arrives per second. | Use a motorway analogy: speed limit is latency, number of lanes is bandwidth; HBM has huge bandwidth, not lower latency. |
| What is Amdahl's law? Gene Amdahl · Concept · Current · Intermediate |
Speed-up from parallelising is limited by the serial fraction: with 10% serial, maximum speed-up is 10x. | Write the formula and work an example; then mention Gustafson's law for growing problem sizes. |
| What does a branch misprediction cost? CPU microarchitecture · Concept · Current · Intermediate |
The pipeline must discard speculative work and restart from the correct path, wasting roughly 10-20 cycles on modern cores. | Mention sorted data making branches predictable, and branchless code or lookup tables as fixes. |
| What happens when you type a command and press Enter? Operating systems · Concept · Current · Intermediate |
The shell parses it, forks a child process, execs the program, the kernel loads it and schedules it, and output returns through system calls. | Name fork, exec, wait and system calls; interviewers love candidates who mention the dynamic loader. |
| What is false sharing? Multicore programming · Concept · Current · Advanced |
Threads updating different variables on the same cache line make cores repeatedly invalidate each other's caches. | Give the fix: pad or align per-thread data to separate cache lines, then show the before and after timing. |
| How would you find why a server is slow? Performance methodology · Concept · Current · Intermediate |
Check CPU, memory, disk and network for utilisation, saturation and errors, then profile the busiest process. | Name tools in order: uptime, top or htop, vmstat, iostat, then perf and a flame graph. |
| What is the difference between RISC and CISC? Computer architecture · Concept · Current · Beginner |
RISC uses simple, fixed-length instructions; CISC has complex, variable-length ones. Modern x86 decodes into simpler internal micro-operations. | Mention Arm and RISC-V as RISC, x86-64 as CISC, and that the line has blurred in practice. |
| What is a deadlock and how do you prevent it? Operating systems and concurrency · Concept · Current · Intermediate |
Threads wait forever for locks held by each other; prevent it by always acquiring locks in a fixed order or using timeouts. | Name the four Coffman conditions and say which one your fix breaks. |
| Why can memory be the bottleneck, not the CPU? Memory hierarchy; roofline model · Concept · Current · Advanced |
Cores compute far faster than DRAM can supply data, so low-reuse code waits on memory. | Mention the roofline model, arithmetic intensity and fixes such as tiling and better data layout. |
| How does a computer boot? Firmware and operating systems · Concept · Current · Beginner |
Firmware (UEFI) initialises hardware, finds a boot loader, which loads the kernel; the kernel then starts the first user process. | Mention Secure Boot checking signatures, and systemd as PID 1 on most Linux systems. |
| TLB miss vs page fault? Memory management · Concept · Current · Intermediate |
TLB miss: the translation isn't cached, so hardware walks the page table. Page fault: the page isn't mapped or present, so the OS steps in. | Add scale: a TLB miss costs tens to hundreds of cycles, while a major page fault that reads from disk can cost milliseconds. |
| How would you debug a slow GPU training job? ML infrastructure · Concept · Current · Advanced |
Check GPU utilisation and memory, then profile to see whether the GPU waits on data loading, CPU work, communication or slow kernels. | Name nvidia-smi, Nsight Systems and PyTorch Profiler; fixes include more loader workers, mixed precision and overlapping communication with compute. |